In the 21st century, businesses in every industry need robust marketing analytics and reporting to analyze the performance of their marketing activities and campaigns.
This is because insights from such reports are integral for developing strategies and even gaining a competitive edge in the marketplace. In short, they can play a central role for business owners and executives to make wise business decisions.
Suppose you are an SMB owner or an entrepreneur. In that case, it will be optimal if you use one of the excellent marketing reporting software to gather, summarize, and visualize all the data so that you can grasp all the actionable insights within a glimpse.
However, selecting the right tool for your business can be challenging and time-consuming since there are dozens of marketing reporting tools in the market. All of which come with different features and pricing ranges that can confuse busy business owners.
I decided to do the heavy lifting for you. This article will only feature the best marketing reporting tools based on my research. You can then handily select the one that suits your preferences and budget and save hours of your valuable time.
Affiliate Disclosure: This article from Victory Tale contains affiliate links. If you subscribe to one of the software, we will receive a small commission from our partners.
Nonetheless, we always value integrity and prioritize our audience’s interests. You can rest assured that we will present each tool truthfully.
Things You Should Know about a Marketing Reporting Tool
Software WITH vs. WITHOUT BI Features
This article will cover both marketing reporting software WITH and WITHOUT business analytics (BI) features. Although both types of tools similarly help you gather and analyze marketing data, they are totally different.
Software WITH BI features will offer a built-in data visualization platform. You will not send your data to third-party software. Instead, all data will be transferred to that platform, and you will perform all the analysis there.
On the other hand, software WITHOUT BI features will only serve as a connector or a facilitator that forwards your data to another third-party BI software.
Typically, this type of marketing reporting tool will offer more connections (some allow you to import data from up to 500 data sources). Therefore, with this tool, you will gain access to more data.
Both sets of tools are powerful and effortless to use. However, if you are an entrepreneur or a beginner in marketing analytics, you should start with tools with business analytics features.
This is because they are far simpler and more beginner-friendly. You can start gathering and analyzing your data right away without worrying about setting up complicated connections. Later, you can switch to those without a BI feature when you need connections that the former does not offer.
Connections
Although all the tools on this list provide connections to the most popular data sources, you may find that some don’t offer connections to some of your marketing channels, mainly if you use a brand-new marketing software product.
Hence, before making decisions, you must double-check whether the tool you choose provides all the connections you need (either natively or indirectly).
Criteria
Below are the criteria for the best marketing reporting tools
- The tool is effortless to use OR offers a detailed tutorial/guide for new users.
- Equipped with powerful features to save you time (i.e., no more copy and paste)
- Provide excellent value for money
- Allow pulling data from abundant data sources + Sufficient integrations (native or through Zapier)
- Receive primarily positive reviews (or above) from real users
- My personal experience with that particular marketing reporting tool must be positive.
With BI Features
1. Dashthis
Dashthis is a solid choice as a marketing reporting tool. If user-friendliness is your priority, Dashthis is the one that you should seriously consider for your business.
Key Features & Onboarding Process
Data Gathering – Dashthis offers as many as 34 native integrations. Thus, you can import marketing data from the following tools:
- Google: Analytics, Ads (Adwords), Search Console, GMB
- Facebook: Ads, Insights, Business Manager
- Instagram, Twitter, Youtube
- SEO Tools: Ahrefs, SEMRush, Moz, Majestic
- CSV Data
- and many more
Furthermore, if your preferred software is not on the list of native integrations, you can add data from it to Dashthis through Google Sheets integration.
In other words, you can export data from the selected platform to Google Sheets and subsequently import it natively to Dashthis platform.
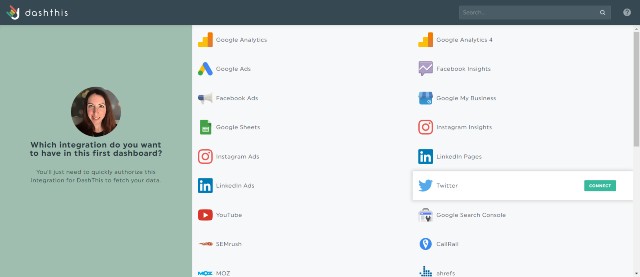
Getting started with Dashthis is straightforward. First, you will select the platform from which you want to import the marketing data. In my case, I will go with Google Analytics.
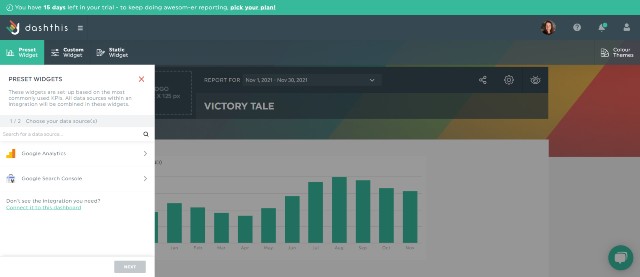
Below is the dashboard you will reach after inputting some information about your project. You can now start creating top-notch marketing reports on this page.
Marketing Report Creation – With Dashthis, creating a well-visualized marketing report is effortless. Just select the data source you want, customize the key metrics, and choose the proper data visualization method. Your report will be ready in seconds.
In addition, Dashthis offers various types of pre-built templates that you can use to create reports, including social media reports, digital advertising reports, SEM reports, and many more.
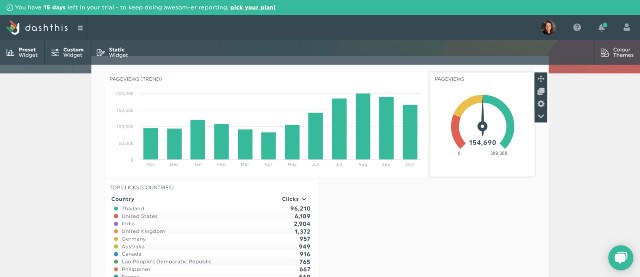
The data visualization is also colorful and compelling. I think it will capture the audience’s attention quickly and sustainably.
Once you have created a quality report, you can just clone it to replicate the format for another project. This feature will significantly speed up your workflow.
I prefer using Dashthis to Google Data Studio since Dashthis is more user-friendly and intuitive. You are extremely unlikely to get lost while using the tool.
Comments & Notes – You can easily add comments and notes to the dashboard to convey your audience better insights.
White-Label Solutions – Dashthis allows complete customization of the dashboard. You can change the color & fonts, replace Dashthis brand with yours, use the custom domain, etc.
Furthermore, requesting a tailor-made custom design is also possible (extra fees apply, please see below).
Automatically updated data – Dashthis will always auto-sync with Google Sheets. If you update your Google Sheets data, all reports that connect with that data will be updated automatically.
Sharing Features – You can easily share your dashboards with team members and clients by email and URL. You can also export them as a PDF file with one click.
From an overall perspective, Dashthis is extremely easy to use. I don’t even need a guide to get started since all features are self-explanatory. However, if required, you can watch the video tour to thoroughly grasp how each element works.
Pricing
Currently, Dashthis offers four pricing plans as follows (all pricing is for annual plans):
- Individual – $33 per month
- Professional – $109 per month
- Business – $209 per month
- Standard – starting at $339 per month
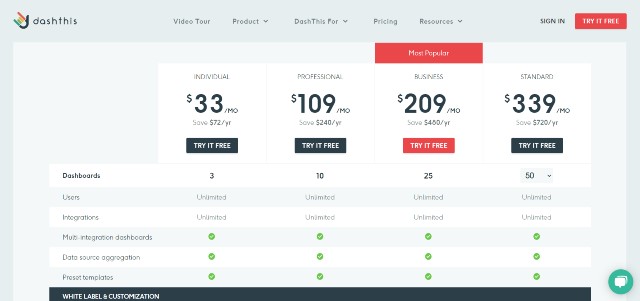
The Individual plan provides access to all the features except custom domain and email, while other plans can access all on the platform.
Unlike Supermetrics, Dashthis does not limit the number of accounts, users, and data sources you can use. Instead, the limit is on dashboards. You cannot have more dashboards than the specified quota.
Therefore, the Individual plan, which allows up to three dashboards, is sufficient for solopreneurs and most SMBs. Custom domain and email are unnecessary if you don’t plan to make your reports public or provide services to clients.
Higher plans will only widen the dashboard limits and nothing else. Enterprises and digital agencies should opt for the Standard plan to customize the limit at will.
Note: If you want a custom design for your digital marketing reports, you need to pay an extra $995 fee one-time.
Start a 15-day free trial to try Dashthis core features (no credit card required).
Pros & Cons
Pros
- User-friendly reporting platform: The user interface is modern and clean.
- All features are effortless to use.
- Beautiful data visualization, which makes it super easy for the audience to digest the insights
- Comments & notes can be highly beneficial in explaining complicated stuff to clients.
- Excellent sharing features to collaborate with team members and present results to clients
- Unlimited accounts, users, and data sources
- Offer several features to smoothen the workflow
- Flexible pricing + Affordable entry price (particularly if you need Google Sheets integration), thus an excellent option for solopreneurs.
- Based on genuine user reviews, Dashthis seems to offer fantastic customer service.
Cons
- The choice of native data connectors (not through Google Sheets) is limited. Connections with popular platforms such as Pinterest are still not available.
- Technical issues are rare but persist.
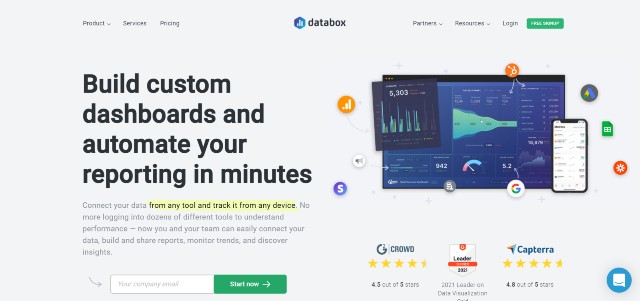
2. Databox
Databox is a robust alternative if you need a BI tool for your marketing campaigns. With its innovative platform and vibrant data visualization, business owners and digital marketers can create a professional-looking report within a few minutes.
Key Features & Onboarding Process
Connect Your Data – Getting started with Databox is straightforward. You first need to select all data sources you need from more than 70 available tools.
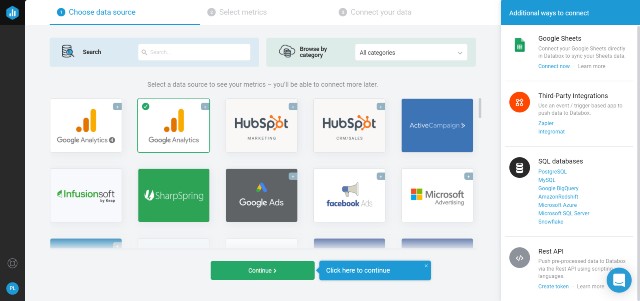
Alternatively, you can connect with your data through Google Sheets, Zapier, and Integromat. If your team has developers, you can also use the REST API and SQL databases (various RDBMS are available) as well.
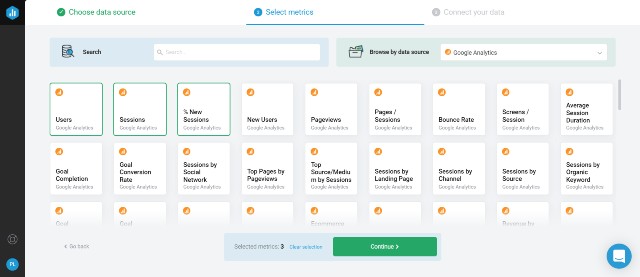
The next step is to choose the key metrics you want for your dashboard. Just select all you need, and everything is all set.
Report Creation – Once you reach Databox’s interactive home screen, you will realize that a preliminary report for the particular data source has already been created automatically.
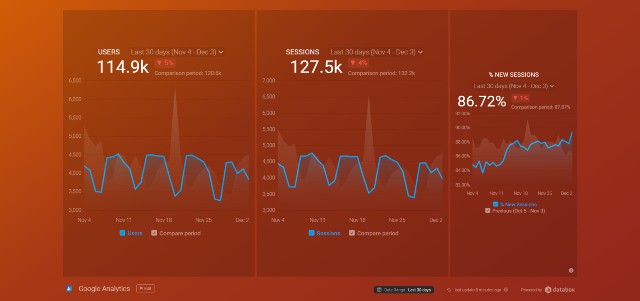
I am fascinated by the quality of the report. The dashboard is interactive, intuitive, and professional-looking. I appreciate its colorfulness and how the data is beautifully visualized.
All you need to do is edit this report. You can add or modify metrics and visualization types in a drag-and-drop manner. Thus, the personalized report will be ready in a few minutes.
Alternatively, you can select from 200+ pre-built templates and create an insightful report from there.
Loop Dashboards – Sometimes, a single dashboard is insufficient to create a solid marketing report. With Databox, you can create a loop dashboard that groups several dashboards.
This feature will make your reports more in-depth and organized, which can also be helpful in company presentations or start-up pitch desks.
Query Builder – In some cases, you may want specific metrics that Databox does not provide on default. However, this will not be an issue since you can create custom metrics for the selected data sources with a Query Builder and use it in your reports.
Data Calculations – With this feature, you can create KPIs from multiple data sources, which is highly beneficial for advanced campaign analysis.
Goals & Tracking – You can set goals and track the progress over time. All goals and progress will be visualized. You can then grasp the crucial information in no time.
Also, Databox can send an alert to inform you that the goal is about to be achieved or goes off track. Hence, it is effortless to keep track of your marketing campaigns.
Sharing System – Databox offers various methods to share your dashboards, including a URL, a snapshot, an HTML code (for embedding in your website), and even streaming to a smart TV. Hence, you have all the effective means to present your marketing data to clients or executives.
Regarding the ease of use, I think Databox is straightforward. I don’t even need a guide to use Databox features. However, you can watch a video tour and read the detailed guide if needed.
Pricing
Databox’s pricing structure is straightforward. The final price depends on the plan you choose and the number of data sources you need.
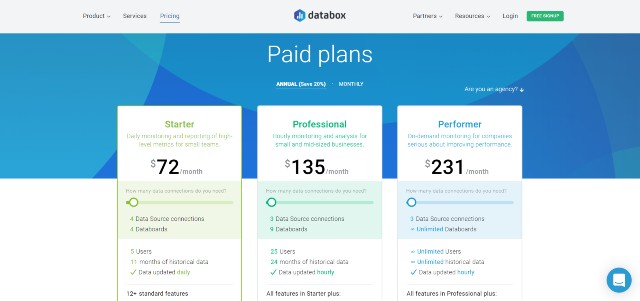
Currently, Databox offers three pricing plans as follows (billed annually):
- Starter – starting at $72 per month
- Professional -starting at $135 per month
- Performer – starting at $231 per month
The Starter plan provides access to all core reporting features. However, you will not be able to use or perform the following tasks.
- Query Builder & Data Calculations
- Integrate your data through Google Sheets and SQL Database
- Customize Date Ranges
- Use historical data dated more than 11 months
I don’t think no access to the first two could be problematic since there are 3000+ metrics and numerous integrations available on default.
However, you can be highly frustrated since you cannot customize date ranges and use dated historical data. Some businesses may not be able to find the tool’s use cases because they cannot compare their data in a practical date range. According to my observation, this has become the leading cause of complaints from real users.
Thus, in most cases, if you want to use Databox, I recommend opting for higher plans. The Professional plan grants access to all marketing reporting features and integrations but limits dashboards, users, and historical data (24 months), while the Performer plan has no limitations whatsoever.
You can first opt for the Professional plan. However, once you use more than 250 dashboards, you will need to upgrade to the Performer plan.
In addition, as mentioned above, the price above is a “starting” price. You will pay extra per month if you need more data sources.
Starter plan users get 4 data source connections at the starting price, while the rest get 3. The table below shows how much you need to pay for an additional data source.
| Plans | Extra Fees per data source |
| Starter | $1.6 |
| Professional | $3.2 |
| Performer | $4.8 |
Note: Starter plan and Professional plan users will get extra dashboard credits if they add more data sources. However, once you hit 50 data sources, your dashboard limit cannot increase further. You will need to upgrade to a higher plan.
If you are unsure whether Databox is right for you, I suggest you create a free account to try its core features (no credit card required).
Pros & Cons
Pros
- Effortless to use + User-friendly platform
- Connect natively with more than 70 data sources (including various project management tools) and another 2000+ third through Google Sheets and Zapier
- Top-notch data visualization
- Offer access to developer tools (REST APIs and SDKs). Thus you can easily connect to multiple channels in a few minutes.
- Creating a custom metric from multiple data sources is possible.
- Include multiple features that can be useful in company presentations
- Excellent sharing system, including Smart TV streaming
- A free-forever plan is available.
- Flexible pricing
Cons
- Starter plan users cannot customize date ranges and compare data year over year.
- A few reviewers noted that they experienced technical issues that caused them to lose their historical data.
- Expensive than most alternatives
- Customization is more restricted than some peers.
3. Whatagraph
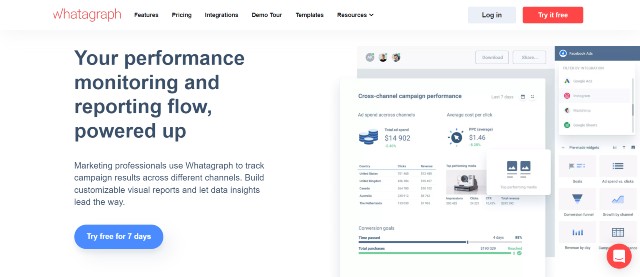
Whatagraph is a robust marketing reporting tool that allows users to track the results of a marketing strategy across different channels. With Whatagraph, you can create a visually pleasing report in just a few clicks.
Key Features & Onboarding Process
Integrations – Currently, Whatagraph offers more than 40 data sources with which you can connect your data. This includes all popular platforms, including Google Analytics, Facebook, Instagram, Twitter, Shopify, Google Sheets, and many more.
I found this process to be smooth without hassles. I just connect Whatagraph with all the platforms I need in one click.
Custom Data and API – Like Dashthis, you can add custom data to Whatagraph through Google Sheets. Furthermore, you can also use the Public API. Hence, you are free to import data from any source.
Report Builder – Once you reach the home screen, you will realize that Whatagraph has created a ready-for-use template for you (see below).
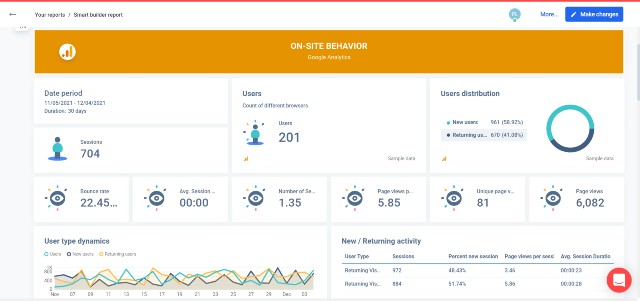
You can then customize this report by using your data (you can even use real-time data), adding & removing metrics, and customizing the elements in a drag-and-drop manner.
With this builder, you can utilize all the connected data sources. Therefore, creating a cross-channel report that showcases cumulative performance is easier than ever.
In addition, the user interface of the builder is excellent. It is fast, clean, and effortless to navigate. You won’t need a detailed guide to use it effectively.
Pre-made templates – Whatagraph has more than 90 pre-made templates that you can use to create an astounding report, effectively speeding up and smoothening the entire process.
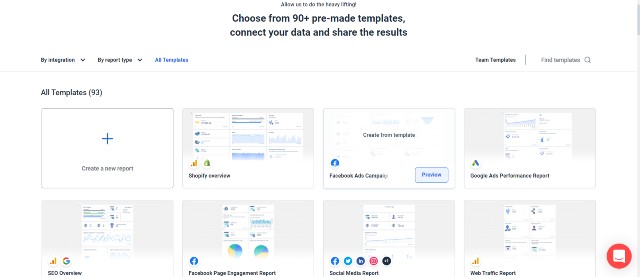
Automated Reports – Manual creation and delivery of client reports every month can be unproductive, boring, and problematic if your team forgets to do so.
This will never be an issue since Whatagraph allows you to automate this task. It will send reports to your clients at a selected frequency. Hence, your clients can access them on time.
You don’t need to worry that such reports will be unprofessional because you can review all the contents before Whatagraph sends them.
White-Label Solutions – Like other platforms, you can fully customize your reports. You can use your logo, change colors, switch to a custom domain, effectively remove all Whatagraph branding, and make the report entirely yours.
From an overall perspective, Whatagraph is a reliable marketing reporting tool with an easy-to-use BI feature. You can use them to craft top-notch reports without spending hours learning. If you value simplicity, Whatagraph is unarguably one of the best options available.
Pricing
Whatagraph offers one of the most straightforward pricing plans as follows (All price below is for annual plans):
- Professional – $119 per month
- Premium – $279 per month
- Growth – starting from $669 per month
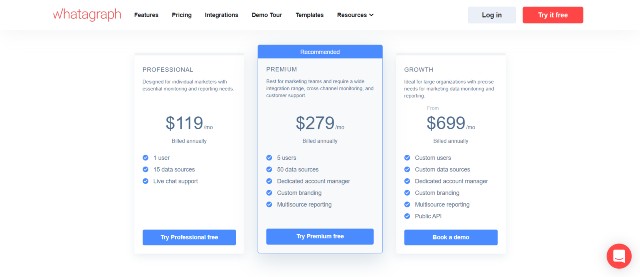
The Professional plan grants access to all core features (except multisource reporting) and 15 data sources, which are more than enough for SMBs.
However, suppose you want multisource reporting, white-label solutions, more user seats, and data sources. It would be best if you opted for the Premium plan.
Finally, you should consider the Growth plan only in two situations as follows:
- You want to use the Public API.
- You need more than five user seats and 50 data sources.
Otherwise, the Premium plan is the most suitable plan for most users.
If you are still not sure how Whatagraph fares against other tools, I suggest you start a free trial to test its features now.
Pros & Cons
Pros
- Clean and user-friendly UI
- Effortless to use + Simple onboarding process
- Import data from all sources through Google Sheets and API
- Create live dashboards that display real-time data
- Automate your report creation and delivery to speed up the workflow
- Straightforward pricing plans
- Excellent support provided through live chat
Cons
- Higher entry prices than peers
- Native integrations are still few, although the team often introduces new integrations.
- Limited customization compared to other tools
4. Oviond
Oviond is an affordable marketing reporting tool that allows users to create compelling digital marketing dashboards within only a few clicks. With its simplicity and affordability, Oviond is one of the preferred choices for many businesses and agencies.

Onboarding Process
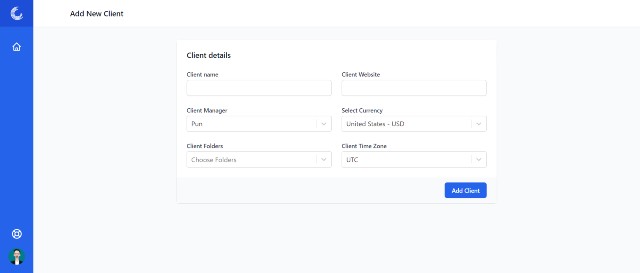
The first step is to add your business or a client to Oviond. The process is straightforward. You just need to input the essential information.
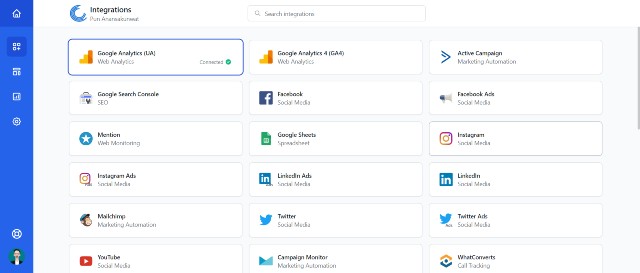
The next step is to connect with the required data sources. There are dozens to choose from, including Google Analytics, Search Console, Shopify, WordPress, PayPal, PPC advertising platforms, email marketing tools, CRMs (HubSpot), and even several SEO tools such as Ahrefs and SEMRush.
The process is super simple. Just click the data sources and the properties you need, and everything is all set.
Subsequently, you only need to select the suitable templates from the list of 120 available, including templates for a conversion rate report, a sales report, a traffic report, and many more.
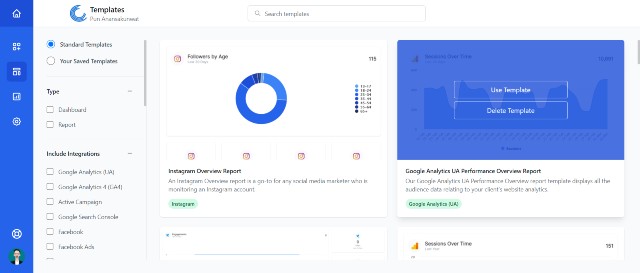
The data will be immediately imported and visualized. Generally speaking, your marketing report will be ready in five seconds.
The newly-generated report is compelling and professional-looking. Every chart is also in the right order (in terms of significance). Thus, extensive manual editing is not required.
Using a drag-and-drop builder, you can take your time to customize or add more data or crucial elements (i.e., other charts) to make your report less generic. You can also create widgets or charts that use multiple data sources to report actionable insights if needed.
Other Features
Automation and Data Auto-Refresh – Oviond will refresh all the data automatically and send new reports straight to your clients’ inboxes.
White-Label – With Oviond, you can white-label your account (with a custom domain and branding). Thus, the platform and all the reports will match your brand voice or corporate identity.
Try Oviond free for 14 days.
Pricing
Currently, Oviond offers three pricing plans as follows:
- Starter Agency – starting at $37 per month
- Small Agency – starting at $74 per month
- Regular Agency – starting at $149 per month
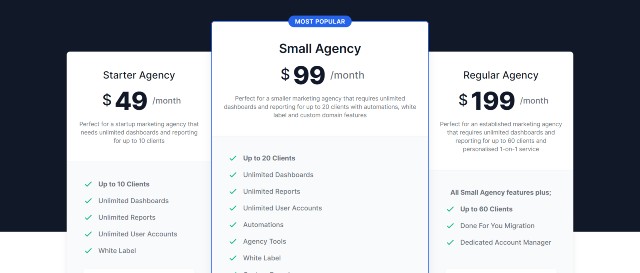
All plans provide access to all marketing reporting tools and allow unlimited reports, dashboards, and user accounts. Thus, businesses with an in-house marketing team only needs a Starter Agency plan.
The Small Agency would add an Automation feature, client limits, and the ability to use a custom domain. This plan is thus optimal for small marketing agencies.
If you want to add more clients, you have to subscribe to the Regular Agency plan, which will come with a dedicated account manager who will handle the entire migration process and other technical-related tasks.
Pros & Cons
Pros
- Smooth and easy onboarding process
- Modern and fast UI
- 120+ professional-looking templates to help create compelling reports in a few minutes
- Auto-refresh all your data
- 30+ native integrations, including all popular digital marketing tools
- Low starting price + Affordable pricing
- 15-day free trial (no credit card required)
Cons
- Oviond’s blended widgets (those that use multiple data sources) are less sophisticated than other tools.
Without BI Features
5. Supermetrics
Trusted by more than 16000 businesses, Supermetrics is unarguably one of the market leaders in this space. You can use this excellent tool to pull data from numerous sources and generate marketing reports within a few clicks.
Key Features & Onboarding Process
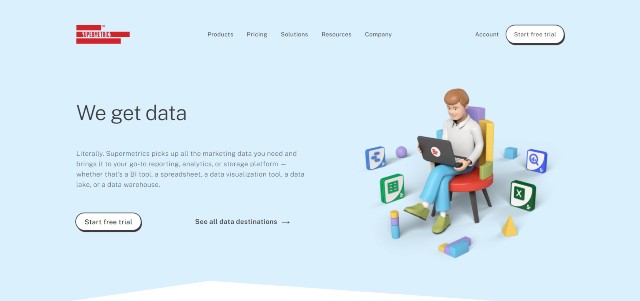
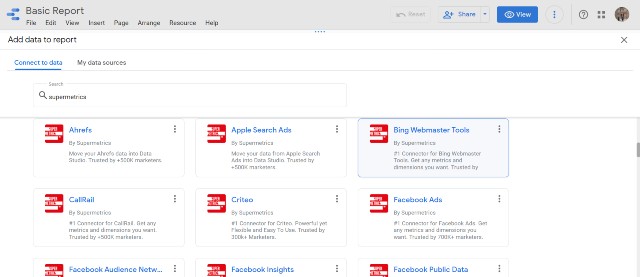
Import your marketing data – This is a core feature of Supermetrics. It allows you to seamlessly import your marketing data from your marketing tools (i.e., Facebook ads, Google Ads, Shopify) to various other platforms such as Google Data Studio, Google Sheets, or Microsoft Excel.
The best thing here is that you can import your data from 70+ sources, including all popular marketing software such as Ahrefs, MailChimp, and many others.
Hence, your marketing team does not need to copy and paste the data manually like before. You can gain access to crucial marketing metrics and generate actionable insights right away.
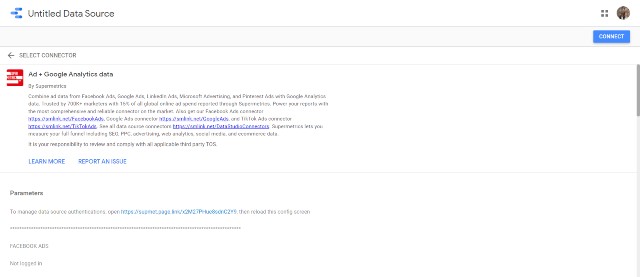
Getting started is straightforward. You first need to authorize the connection of your marketing tools with Supermetrics. You can do this in a few clicks. Just make sure that you connect to all the data sources you need.
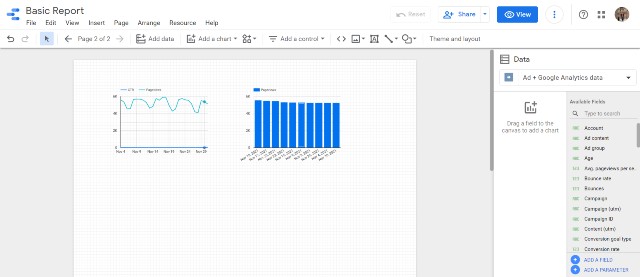
Marketing Reports – Once you connect all your data sources, you can visualize data by creating charts and analyzing them simultaneously on the same dashboard.
You can then easily compare and contrast the effectiveness of each marketing campaign and create custom reports for executives to make better decisions regarding marketing efforts.
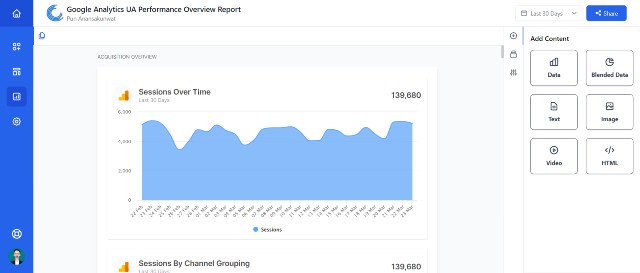
To use the newly imported data, you will need to click “Add Data” and select data sources “by Supermetrics.”
For example, I created a preliminary marketing report utilizing various data imported by Supermetrics below.
Note: You can also use both sources connected by Supermetrics and other connectors to generate the most comprehensive and insightful reports.
Automation – With Supermetrics, your team can automate the pulling process. Thus, this feature frees your marketing team from manually importing data every week or month.
Supermetrics Sidebar – If you plan to move your data from any marketing platform into Excel or Google Sheets, you can use Supermetrics Sidebar smoothly without leaving the original platform. Just select the metrics and dimensions and your data will arrive in a ready-to-use manner.
Regarding the onboarding process, I think it is self-explanatory. You can visit the support portal to read the detailed guide or create a ticket to contact the support team if you are still struggling.
Pricing
Supermetrics offers different pricing plans depending on the platform you want to import the data.
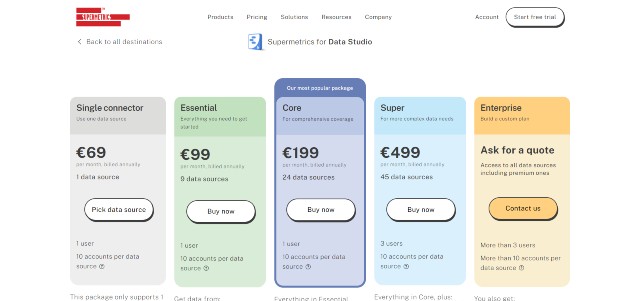
Supermetrics for Data Studio (billed annually)
- Single Connector – €69 or approximately $78.2 per month
- Essential – €99 or approximately $112.2 per month
- Core – €199 or approximately $225.6 per month
- Super – €499 or approximately $565.7 per month
- Enterprise – Custom Pricing
All plans provide access to all the features. The only difference is the number of data sources you can connect.
The Single Connector plan supports only one data source. You can pick any data source you want and import your data from ten accounts.
I don’t think this plan is worth subscribing to since you cannot integrate data from different sources. It may only be helpful if you have multiple accounts on a particular marketing tool and want to combine them.
For example, you own or manage multiple websites and would like to merge Google Analytics data for comprehensive analysis.
It would be best to opt for the Essential or the Core plan. The Essential plan is decent. By paying $112.2 per month ($34 higher than the Single Connector plan), you will be able to get data from all of the following platforms: Google Analytics, Google Ads, Google Search Console, Facebook Ads & Insights, and Instagram.
However, the significant drawback of this plan is that it does not include other popular data sources. If you want to import data from LinkedIn, Twitter, Youtube, Snapchat, Pinterest, you will need to subscribe to the Core plan.
Hence, the Core plan appears to be the best option for most businesses since they can get their hands on almost all of the tools they use in their advertising campaigns.
The Super plan would allow users to import data from all other marketing tools with a paywall (such as Ahrefs, Shopify, and Hubspot). However, it will not offer much value if you never use those tools in the first place.
Alternatively, if you subscribe to the Essential or Core plan and would like to import data from another data source not included in the plan, you can do so by paying €15 or $17 per month per source.
This option will save you money because you don’t need to pay an additional $340 for a single data source (i.e., Shopify).
Unfortunately, this option is limited to a single source for the Essential plan and two for the Core plan. Thus, you need to decide which data you need most wisely.
Important Note: All Supermetrics plans below the Super plan grant only one user seat. Hence, digital marketing agencies and enterprises that need more than one user seat have to pay $499 or more for the Super/Enterprise plan.
Try Supermetrics for Data Studio for free (14-day free trial)
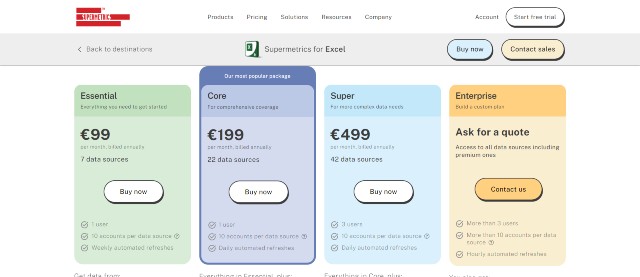
Supermetrics for Excel/Google Sheets
- Essential – €99 or approximately $112.2 per month
- Core – €199 or approximately $225.6 per month
- Super – €499 or approximately $565.7 per month
- Enterprise – Custom Pricing
These plans apply to Excel and Google Sheets. However, you can only opt for one tool (no single plan allows you to import your data to both). If you want both, you will need to subscribe to each separately.
All the plans function similarly to Data Studio’s. The only difference between each plan lies in the availability of data sources.
Again, it would be optimal to choose the Core plan since it allows you to import data from all crucial marketing platforms. You can also add a data source at an inexpensive rate ($17 per month) if you want data from premium marketing tools.
Try Supermetrics for Excel or Google Sheets for free (14-day free trial)
Pros & Cons
Pros
- One of the best marketing reporting tools to centralize your data
- Effortless to use + Smooth onboarding process
- Seamlessly import all your marketing data into Google Data Studio, Google Sheets, and Excel to integrate them into the same dashboard
- Offer robust features to save your valuable time
- 70+ data sources are available, which is far higher than most competitors.
Cons
- Costlier than most alternatives
- According to the pricing page, Supermetrics does not offer a monthly plan for users to subscribe to. You can only opt for the annual plan.
- You will need to pay a hefty $499 or higher to get more user seats.
Other Alternatives
Below are some other alternatives that you may want to consider. However, I chose not to include them on the list because of the particular reasons explained below.
Raven Tools – Despite being known as an SEO tool, Raven Tools offers an easy-to-use suite of marketing reporting tools. However, its features and reporting templates are far more limited compared to those on the list.
Metricool – Metricool is an all-in-one platform that allows users to centralize data management and import data to Data Studio. However, at present, the platform allows only a few data sources. It may not be the best option at this point.
Improvado – With Improvado, you can connect with more than 200 data sources and transfer all the data to be analyzed. However, they do not provide pricing data on their site, implying that their pricing may be off the charts for SMBs.
Porter Metrics – Porter Metrics is essentially a Supermetrics alternative. It helps you connect your data to Google Data Studio. Although its price tag is lower, its available data sources are far more limited than Supermetrics at this point.
Funnel.io – Like Supermetrics, Funnel.io serves as an exceptional data connector. You can connect to more than 260+ platforms. However, the pricing starts at $399 per month, which is too pricey for SMBs.
Apipheny – Apipheny is a solid solution to pull all your data into Google Sheets. This tool can hence be a far more affordable alternative to Supermetrics (for Google Sheets only). However, it does not offer other features like those on the list.
If you are interested, you can buy lifetime access from Appsumo by paying only $149.
Related Tools
Below are lists of the best software products you may also be interested in.
Social Media Analytics Tools /Social Media Reporting Tools – Coming Soon
SEO Audit/SEO Reporting Software – Coming Soon
Keyword Clustering Tools – Excellent tools that can group keywords to be targeted simultaneously in SEO.