Technical analysis software is a vital tool for making informed trading decisions. It allows traders to find the best time to enter or exit their positions, potentially allowing them to reap considerable profits.
Unfortunately, not all technical analysis software is worth using. Each has different pros and cons. Some have a steep learning curve, while others have too few features to be worth the price.
You will need to conduct research before investing in the tool. Unfortunately, since hundreds of tools are available, this can be tedious and time-consuming.
Therefore, I decided to do the heavy lifting for you. This article will feature only the best technical analysis software and outline its pros and cons. You can then choose the one that suits your preferences and budget and start using them right away.
Affiliate Disclosure: This article from Victory Tale contains affiliate links. We will receive a small commission from our partners if you subscribe to their services.
Nonetheless, we always value integrity and prioritize our audience’s interests. You can rest assured that we will present each software truthfully.
Things You Should Know
Stocks or Other Assets?
Most of the technical analysis tools featured in this post cover only US stocks. However, few of them can be used to analyze other assets, including but not limited to:
- Global Stock Markets (Europe, Japan, India, China, Australia, Emerging Markets. etc.)
- Cryptocurrencies (Bitcoin, Ethereum, etc.)
- Foreign Exchange (EURUSD, USDJPY, etc.)
- Commodities (Gold, WTI, etc.)
Hence, it is crucial to consider all your needs before subscribing to any tool.
A Short Note Regarding Market Volatility
The financial markets are much more volatile during recent years. Price patterns can change swiftly within seconds, and signals from indicators are less reliable.
As a result, if you are a day trader who relies on charts, you will need to respond and make decisions even faster. Otherwise, your trading capital may vanish.
Free tools (even with small delays) are not going to do the job well under such circumstances. Thus, you will need robust technical analysis software more than ever.
Criteria
Below are the criteria for the best technical analysis software:
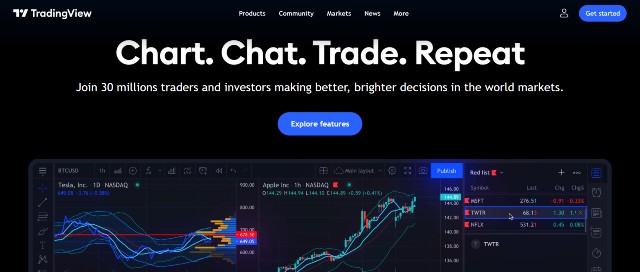
1. TradingView
Used by more than thirty million market participants worldwide, Tradingview is one of the most popular technical analysis software. If you are looking for a reliable tool to interpret charts of any global securities, TradingView is unarguably one of the best you could find.
Onboarding Process
TradingView’s core strength lies in its ease of use. The user interface is modern and fast, allowing users to access the interactive charts within a few clicks.
However, if you are a first-time user, the chart page might appear cluttered to you. The reason is that TradingView packs all the features on this page, which will be super helpful once you are familiar with the tool.
I suggest giving yourself some time to navigate and try all the features. Most of them are self-explanatory for those who have learned some technical analysis. Still, you can visit the tutorial page or read the documentation if needed.
Key Features
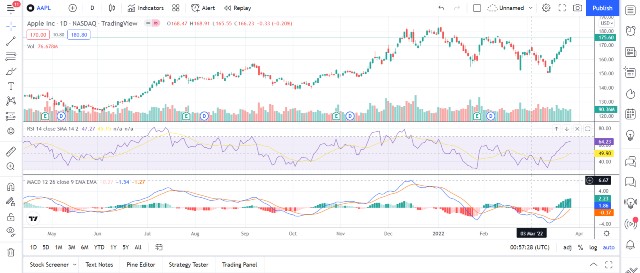
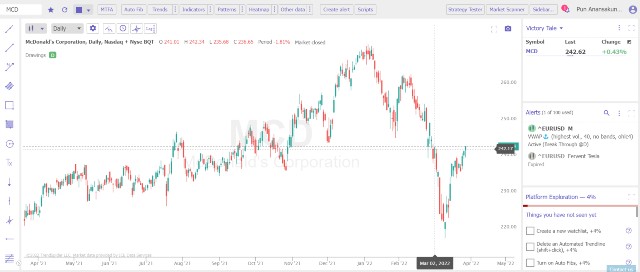
Interactive Charts – TradingView’s charts are interactive and customizable. It plots the trading data of specific securities over time, including price and volume.
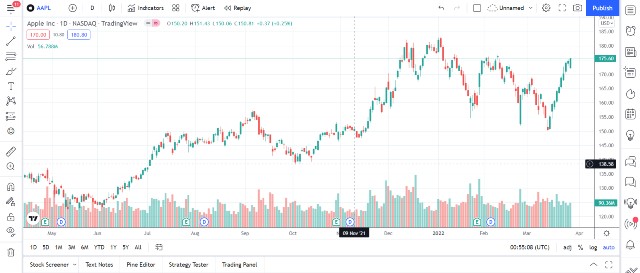
The chart will be in candlesticks by default. However, you can freely switch to another chart type. There are as many as 12 chart types to choose from, including Bars, Point & Figure, Renko, Kagi, Heikin Ashi, etc.
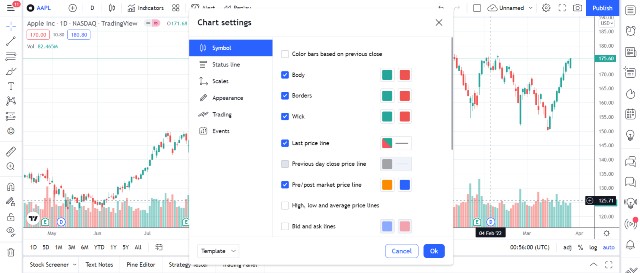
If you are from Japan or other countries that use different charting configurations (i.e., red for a price increase), you can customize the chart settings at will.
Markets – TradingView is one of the very few technical analysis software that supports almost all tradable securities worldwide.
You can use the platform to analyze pricing patterns of a US stock, an Indian stock, stock indexes (DJIA, S&P500), Bitcoin, USDJPY, bonds, commodity futures, and many more.
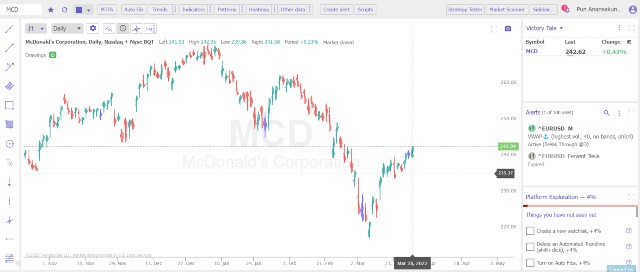
Historical Data and Custom Time Interval – TradingView supplies traders with a deluge of data across multiple time frames. I found out that I could view the pricing data of Apple Inc. as early as December 1980, which is when the company went public!
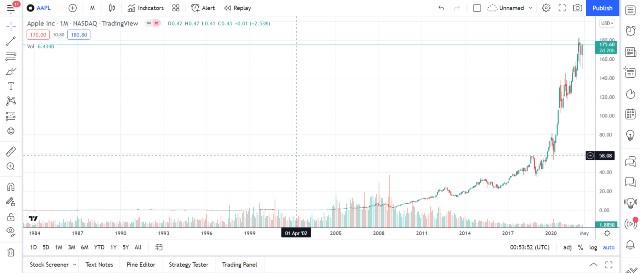
This is more than 40 years of historical data! Based on my observations, very few charting tools offer historical pricing data that stretch more than ten years. Hence, TradingView is a definite choice for traders and investors with a longer investment time horizon.
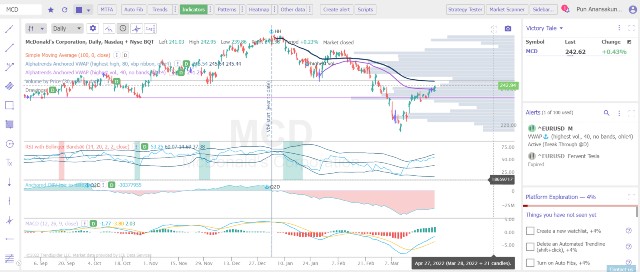
Pre-built Indicators and Chart Tools – TradingView has more than 100 of the most popular technical indicators, such as RSI, MACD, Stochastics, that you can apply to your chart.
Simultaneously, you select from 50+ pre-built chart tools, such as Fibonacci Retracements or Gann Fann, and apply them to your chart.
For example, I added the RSI and MACD to my chart below.
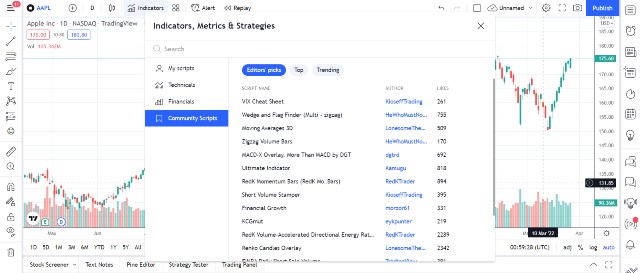
Community-built indicators and strategies – This feature probably makes TradingView the most loved technical analysis software. You can search and use any technical indicator or strategy that fellow traders previously created.
Currently, there are 100000+ community indicators and strategies from which you can choose. Some of which are from famous traders that you may be familiar with (such as Wyckoff).
Hence, if you adhere to a “niche” trading strategy, you will find all the tools you need in TradingView’s arsenal.
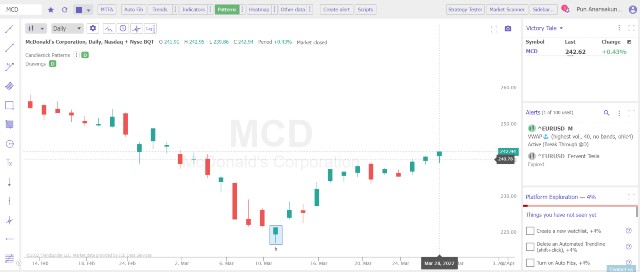
Pattern Recognition – TradingView can automatically detect specific chart and candlestick patterns on the chart. Hence, you do not need to analyze whether the stock forms a particular pattern manually. This feature saves you time and allows you to focus on other tasks.
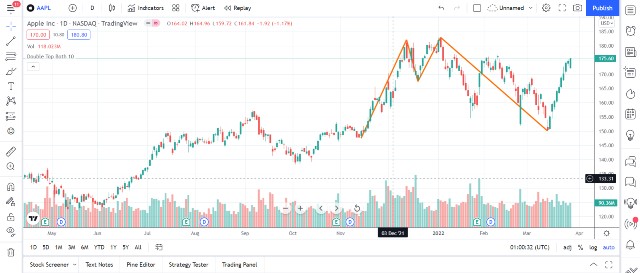
Also, I like this feature because it comes with an informative explanation of the pattern. Hence, if you are new to technical analysis, you don’t need to search for how to interpret it at all.
Currently, there are dozens of patterns to choose from. Since this feature has only been introduced recently, more patterns will be added soon.
Fundamental Analysis – You can insert crucial fundamental analysis data into your chart, including earnings & dividend data. Hence, you can monitor the change in stock price vis-a-vis the development of the company’s financials.
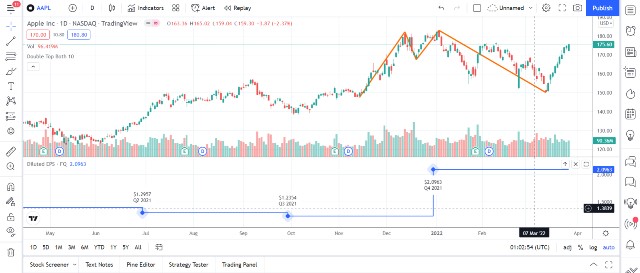
This feature can be useful if you are a techno-fundamental investor or just want to benefit from a sharp stock movement before or after the earnings release.
Stock Screener – TradingView has a built-in stock screener that you can use to find tradable stocks. There are numerous filters that you can apply to a list of stocks to find the most suitable ones for your trading strategy.
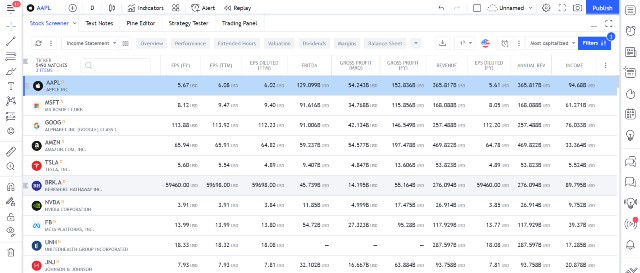
Regarding filters, you can use include fundamental (i.e., P/E, ROE, D/E Ratio) and technical ones (i.e., weekly performance, RSI below 30, new all-time high). Hence, you don’t need to subscribe to another stock screener tool.
Forex and Crypto Screeners – Both screeners work similarly to their stock counterparts. Just input the criteria and TradingView will show the results within seconds.
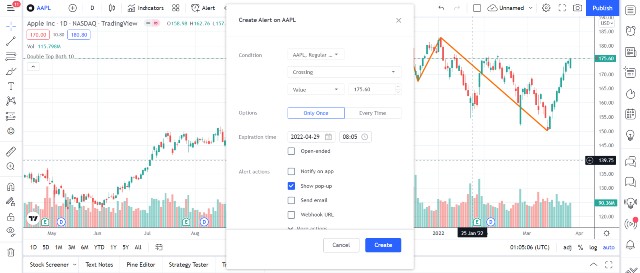
Alert System – TradingView has an effective built-in alert system. You can configure the system to send alerts to all your devices once the specific condition is fulfilled. Such conditions are perfectly customizable. Hence, you will not miss any trading opportunities.
Paper Trading and Strategy Tester – Experimentation is essential for trading success. TradingView allows you to do so through a paper trading tool and a strategy tester. Hence, you can grasp how your skills or strategies fare in real life without risking your capital.
Brokerage Integration – You can integrate TradingView with your brokerage to buy and sell securities directly from TradingView’s charting platform. Currently, TradingView supports more than 50 stock and forex brokers worldwide. You can view the list by clicking here.
News & Calendar – You can access headlines and important dates of the specific stocks or other securities directly through the TradingView platform.
The drawback is that most news is only from English-language sources (such as Reuters.) Hence, it mostly does not feature news from local sources that use the native language.
For instance, you will never receive news from financial Japanese news sites that do not use English. Hence, this may not be optimal for traders who trade in Japanese stock markets.
Chat and Streaming – With chat and streaming features, you can communicate with other traders (both publicly and privately) in real-time and share or discuss your trading ideas.
Generally speaking, TradingView is a versatile technical analysis software. It offers everything you need for successful trading, ranging from charts, alerts, data, news, a strategy tester, and even a built-in trading panel. Hence, you don’t need to use other stock research tools.
If you are unsure whether TradingView is for you, I suggest creating a free-forever account to try most of its core features.
Pricing
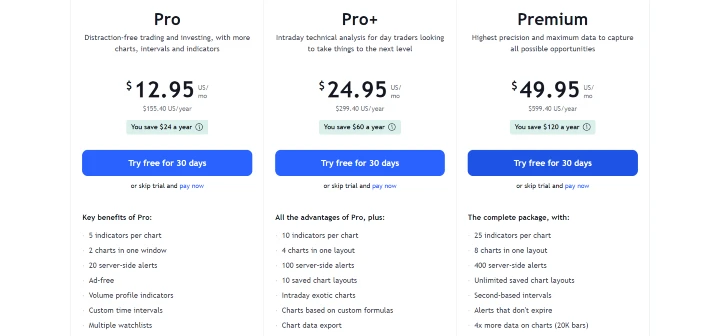
TradingView offers three paid plans as follows:
- Pro – starting at $12.95 per month (billed annually)
- Pro+ – starting at $24.95 per month (billed annually)
- Premium – starting at $49.95 per month (billed annually)
The Pro plan provides access to all the above features, albeit with limited resources. For example, it allows users to place only five drawing tools (indicators, strategies, and pattern recognition all counted) on the chart simultaneously. If you are beyond this limit, you will need to remove existing tools before adding new ones.
From another perspective, TradingView counts three exponential moving average lines as three tools. Therefore, you can only add two other technical indicators, such as MACD and RSI.
If you want to add a Bollinger band later, you need to remove your previously added tools.
Unless you rely on very few indicators in your trading, I don’t think five tools would be enough for most traders to conduct a comprehensive chart analysis.
Hence, I suggest skipping the Pro plan and subscribing to either Pro+ or Premium plans. You will pay only an additional $7.5 or $20 per month, but you will have far higher resources to facilitate your trading. This can return thousands of dollars, hundreds of times the extra monthly investment.
Real-Time Data Fees
Unlike most other technical analysis tools, you will need to pay extra fees for real-time data. The fees are different market by market. For instance, NASDAQ and NYSE data feed cost $2 per month, while BSE’s data feed can cost as high as $5 per month.
You can start a 30-day free trial to try any paid plan.
Pros & Cons
Pros
- Provide users with numerous indicators, strategies, and other tools to perform comprehensive price & volume analysis
- Straightforward to use
- Everything is customizable.
- Offer highly informative historical data (both fundamental and technical) for global markets (US, EU, Asia-Pacific, India, etc.)
- Allow third-party tools
- Equipped with a built-in stock screener and a news aggregator to help users find trade ideas and grasp real-time news
- Web-based: the software is accessible from any device.
- Reliable alert system
- With brokerage integration, TradingView becomes an all-in-one stock trading software because users can trade directly on the platform.
- A free forever plan is available.
Cons
- Limited technical indicators per chart
- The platform has numerous features, which can be overwhelming for new users.
- All users have to pay additional monthly fees to access real-time data.
2. TrendSpider
If I am to name a formidable rival to TradingView, I don’t think any other tool deserves the spot more than TrendSpider. Powered by machine learning, the platform smoothens many tedious tasks, allowing traders to make trading decisions more accurately and confidently.
Onboarding Process
Once you log in to your account, TrendSpider will prompt you to start an in-app interactive training. This training is super helpful to help you master all the features.
It took me five minutes to complete it. Upon completion, I am familiar with the platform enough to use it effectively.
Although its overall ease of use is in line with TradingView, you still need at least intermediate knowledge of technical analysis to utilize TrendSpider at its full potential.
Fortunately, TrendSpider has offered excellent support for new users, including on-demand video training (5+ hours in total), documentation, and 1-on-1 training. Hence, you can learn technical analysis and how to use the platform from the very beginning.
Key Features
Charting Platform – TrendSpider’s core strength is its top-notch charting tool. The chart is interactive and perfectly customizable. You can select from one of the size types: Candlesticks, Bars, Lines, Hollow Candles, Heikin Ashi, and Raindrop charts.
A Raindrop chart fascinates me. It is probably the only technical chart type that takes both price and volume into account, giving you a whole new perspective of the current price & volume action.
Regarding the user interface, I think it is less cluttered than TradingView. Navigating through all tools is a bit easier.
Technical Analysis Indicators – TrendSpider has as many as 138 pre-built indicators that you can carefully add to your stock chart. Every indicator allows advanced customization, which makes it suit any advanced strategy.
If you have not seen the indicator you need, you can request one by contacting customer support.
Markets – Currently, TrendSpider supports US stocks, commodities, FX, and crypto. Unlike TradingView, the platform does not cover global equities.
Automated Technical Analysis – Drawing trendlines, support & resistance areas, and Fibonacci retracements can be tedious on several trading platforms.
This is not an issue with TrendSpider, because the platform will automatically perform all these tasks for you. Just click the “Trends” or “Auto Fib” button; the tools you need will instantly populate your charts.
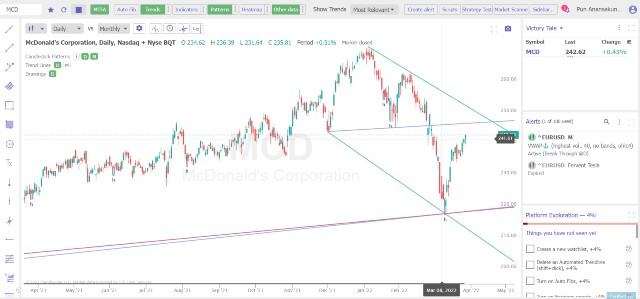
Like other features, you can fully customize how TrendSpider draws trendlines or detect candlestick patterns. Therefore, you do not need to worry that these tools will not fit into your trading strategy.
Based on my observations, these tools are accurate and reliable. Hence, I am confident that they will be beneficial in helping you make trading decisions.
Breakout & Candlestick Pattern Detection – TrendSpider can automatically identify breakouts and candlestick patterns on the chart. Regarding the latter, you can select from dozens of patterns for TrendSpider to detect them.
Since these two features are pretty accurate, they are substantially useful for beginners who are still unable to detect tradable patterns on their own.
Multi-timeframe analysis – This feature will reveal all the trendlines or support & resistance zones across multiple timeframes (Daily, Weekly, Monthly, etc.) on the same chart. Hence, this can help you gain actionable insights that can refine your trading decisions.
Asset Insights – This feature provides all non-technical information relevant to the specific financial security you are interested in, including news headlines, corporate events & actions, insider trading, market breadth, and many more.
My favorite tool is the price seasonality tool, which allows me to determine whether the asset price has a particular moving pattern during some parts of the year. This can be super useful if you trade cyclical stocks or commodities.
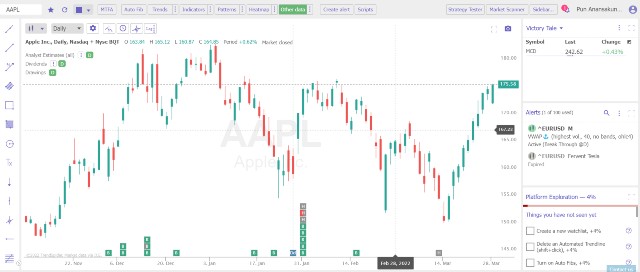
Another innovative tool worth mentioning is the Analyst Estimates tool. Its functionality is to unveil the relationship between price action and analyst recommendations. Hence, you will grasp which equity research analysts the market heeds.
Market Scanner – Unarguably the best stock scanner for technical traders, this tool will scan the market for stocks in specific conditions. For example, I can use the tool to browse for those with a recent MACD bull cross or a golden cross.
The tool comes with pre-built or community-built criteria that you can use right away. Alternatively, you can create unique ones that fit your strategy as well. As a result, you will never lack trading opportunities.
Unusual Options Activity – TrendSpider offers a built-in unusual options activity tracker that lets you track block & sweep trades and other large money bets on the market in real-time. With this tool, you do not need to pay for other expensive software to do the task.
Strategy Tester – Like TradingView, you can use TrendSpider to create or refine a brand-new strategy by mixing indicators, price & volume actions, and chart patterns. Subsequently, you can test it with 20+ years of historical data to ensure that the system withstands the test of time.
Alert System – TrendSpider has a sophisticated alert system. You can create SMS/in-app/email/push alerts for any indicator, trendline, Fibonacci levels, or even create customizable alerts of your own.
You can TrendSpider free for seven days (a credit card is required.)
Pricing
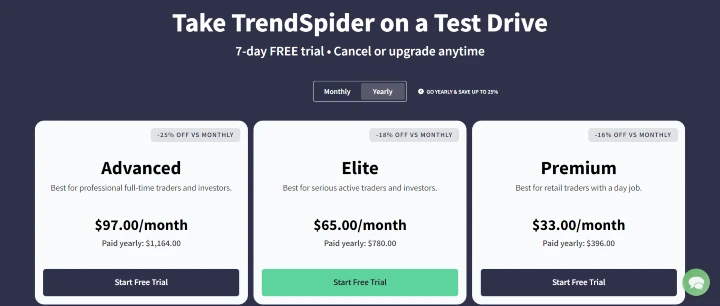
TrendSpider now offers three pricing plans as follows (billed annually):
- Premium – starting at $33 per month
- Elite – starting at $65 per month
- Advanced – starting at $97 per month
All plans grant access to real-time market data and essential features. However, Premium plan users cannot use backtesting, multi-factor alerts, intraday market scanning, and have limited asset insights features. Not having these features will significantly hamper the platform’s capability.
It is optimal for all traders to start with the Elite plan, which provides access to all features and priority support.
The Advanced plan will add more resources (i.e., monthly alerts, workspaces, etc.) but no new features. Hence, I do not think individual traders will need this plan.
Pros & Cons
Pros
- Unarguably one of the best stock analysis software for technical traders
- Innovative trading platform powered by machine learning + Unarguably one of the most advanced technical analysis tools
- Cover US stocks, ETFs, Futures, Forex, Crypto
- Offer excellent educational resources to help beginners get started
- Insightful Raindrop charts
- Feature several automated tools that speed up your analysis and decision-making process
- Include non-technical tools to help you generate actionable insights from the data
- Real-time data for all plans
- Reliable alert system
- Web-based: the software is accessible from any device.
Cons
- High entry price + No free-forever plan
- A credit card is required to start a free trial.
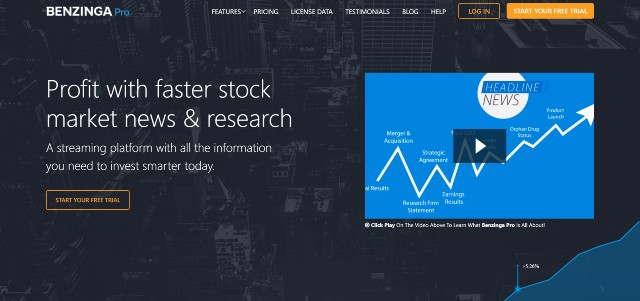
3. Benzinga Pro
Are you a day trader whose trading strategies require fast quote delivery? If that is the case, I don’t think there is any other technical analysis software that fits you more than Benzinga Pro.
Onboarding Process
Using Benzinga Pro is effortless. Each feature is pretty self-explanatory. Thus, I don’t think you will need a tutorial to use Benzinga Pro at its full potential.
You can fully customize your dashboard. If you think it is too cluttered, you can remove each widget independently. Hence, you can create an ideal workspace of your choice.
Key Features
Benzinga Pro is indeed a full-fledged stock analysis tool with numerous valuable features. However, its strength lies in its super-fast delivery of stock quotes, which can significantly benefit traders.
Stock Charts – Powered by TradingView, this feature allows you to track price & volume in real-time.
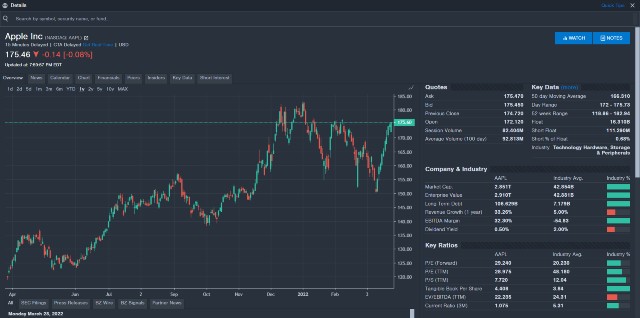
Based on my observations, it is more or less a toned-down version of TradingView’s charting software. You can only use basic features (such as charting and 100+ pre-built indicators and drawing tools) but nothing else.
Newsfeed – A successful technical trader needs to grasp the news and information quickly. With this Newsfeed platform, you will receive the headline as fast as mutual funds or hedge funds that use Bloomberg Terminal. Hence, you can act fast and secure lucrative trading opportunities before they evaporate.
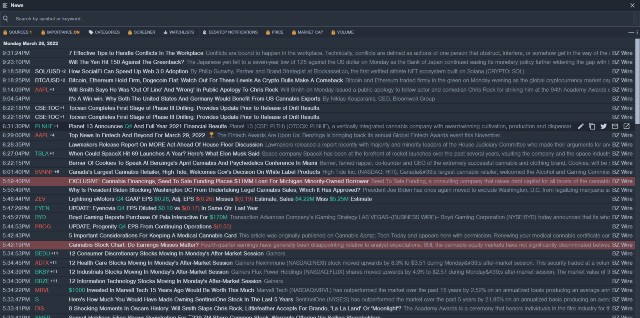
Furthermore, this platform is equipped with a price sentiment engine. It will evaluate market sentiment and explain why the price moves in a specific direction. Hence, you will never be left in the dark anymore.
Real-time Stock Scanner – This feature functions as a traditional stock screener but uses real-time data in all of its calculations. Therefore, you will hardly run out of new trading opportunities during the trading day.
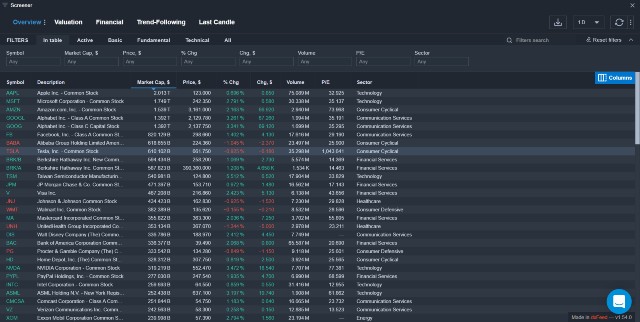
You can also access the financial data of each specific stock you are interested in. However, the information is not as in-depth as stock analysis tools like Stock Rover or Gurufocus.
Calendar Suite – You can find all the “important dates” and “chronological events” of a specific stock from the single dashboard. These events include a history of previous dividends, earnings, analyst ratings/guidance changes, conference calls, etc.
This feature can be beneficial if you want to determine which previous event may affect the price & volume actions in the past.
Alerts – Benzinga Pro can send three types of alerts: Browser Notifications, Sound Alerts, and email. You can fully customize them to ensure that they satisfy your needs.
Chatroom – Benzinga Pro has as many as seven chatrooms platform-wide for traders to communicate, exchange their opinions, or ask questions. There are moderators who actively monitor all chatrooms. Hence, you can be sure that the conversation will not be off-topic.
Bottom Line: Although Benzinga Pro’s charting features are apparently inferior to TradingView and TrendSpider, what the platform offers is still sufficient for most traders.
Suppose you never use flashy technical indicators or strategies and rely more on fast information delivery. In this case, Benzinga Pro is unarguably the best option you could find.
You can request a demo to try Benzinga Pro and its technical analysis features or create a free account to test how the platform works.
Pricing
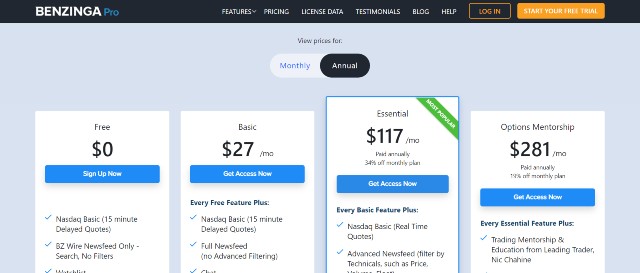
Currently, Benzinga Pro offers three pricing plans as follows:
- Basic – $27 per month
- Essential – starting at $117 per month (billed annually)
- Options Mentorship – starting at $281 per month (billed annually)
I suggest avoiding the Basic plan. This is because it does not offer real-time data and news, depriving the platform of its greatest strength.
At $27 per month, the Basic plan is no match to TradingView’s Pro+ plan since the latter offers more features at a far cheaper price tag.
If you want to use Benzinga Pro, the Essential plan is optimal. This plan offers everything you need, ranging from charting tools, a real-time stock screener, and a reliable news feed.
You should consider the Options Mentorship plan only if you are a novice options trader who wants additional assistance from experts.
Stock traders and veteran options traders do not need this plan. They can subscribe to the Essential plan and add an unusual options activity tracker for $27.97 per month, saving as much as $150 monthly.
Pros & Cons
Pros
- Include real-time market data for the Essential plan and above. The data is institutional-grade, so that it will be way more “real-time” than other platforms.
- Clean and fast user interface, making it super easy to navigate through all features
- Web-based: the software is accessible from any device.
- Effortless to use
- Simplified technical charting tool with 100+ pre-built indicators and drawing tools
- Offer a built-in real-time newsfeed, which will report headlines and key stories in the fastest manner
- Flexible and reliable alert system
- A free forever plan is available.
Cons
- Charts are powered by TradingView but lack many of the original’s most powerful features.
- Costlier than most other tools
4. Scanz
Scanz is a top-notch marketing scanning and stock analysis tool. The platform claims to provide “extreme real-time” data and news, which can grant you a significant advantage in turbulent markets.
Onboarding Process
Unlike most other platforms on this list, Scanz is not a web-based software. You will need to download the software and install it on your computer. The process takes a few minutes since the software is pretty lightweight.
All of Scanz’s features are pretty self-explanatory. I do not think you need a detailed tutorial. However, you can always go back to Scanz’s informative walkthrough if required.
Based on my observations, the user interface is decently clean. Navigating through each feature is without hassle. The only thing that I am not fond of is the font, which makes the text slightly difficult to read.
Key Features
Streaming Charts – This feature plots the price & volume action of the specific stock. You can later choose from a variety of technical indicators to interpret them.
Compared to TradingView and TrendSpider, fewer indicators and drawing tools are available on Scanz. However, this will not be problematic if you mainly use popular ones (RSI, MACD, trendlines, retracements, etc.) in your trading.
Montage – Scanz’s Montage presents an overview of the stock, which includes financial data, SEC filings, time & sales, pre/post-market data, and relevant stats.
Level 1 and Level 2 Data – Scanz is the only tool on this list that provides both Level 1 and Level 2 real-time market data. Hence, you will gain more insights into the demand and supply of the stock in real-time.
Market Scanner – This flagship feature from Scanz allows you to scan the market for the right trading opportunities. You can use various criteria, including fundamental, technical, liquidity, etc.
Its greatest strength is the usage of real-time data. Thus, you can scan when the market is open and trade the stock right away.
Breakout Detection – Breakouts can yield handsome profits to traders in a very short period because of their sharp price movement. However, these events do not occur very often. This tool will scan US stock markets for different breakouts, including price and volume breakouts.
You can also use this same tool to detect block trades that can drive the stock price significantly higher or crash it down.
Notifications – Like other tools, Scanz is equipped with a built-in alert system, which will send alerts in-platform or through email if specific conditions are met. These conditions are fully customizable. Hence, you will never miss a lucrative opportunity that arises.
If you are interested, you can start a 7-day free trial to test all of Scanz’s features (no credit card required.)
Pricing
Scanz has a straightforward pricing structure. You can get all of the above features by subscribing to the Scanner plan, costing $99 per month.
However, there are add-ons you can purchase to improve the capability of the software, including
- OTC Package ($15 per month) – The OTC package provides level 1/level 2 data, SEC filings, and news for OTC stocks. If you trade OTC stocks, this package might prove a worthy investment.
- News ($50 per month) – This plan adds news streaming and SEC filings reports to your platform. Hence, you will have a complete set of tools to trade under any circumstances.
Pros & Cons
Pros
- Real-time Level 1 and Level 2 data are available for all subscribers.
- All features are easy to use.
- Powerful market scanner
- Offer one of the best breakout screeners available to individual traders
- Effortless to choose
Cons
- Not web-based: Download and installation of the software are required.
- The font makes all the texts on the platform somewhat difficult to read.
- Fewer indicators and drawing tools than other platforms
5. Tickeron
Tickeron does not function like a “traditional” technical analysis software, unlike other tools on the list. Instead, Tickeron uses AI to search for securities forming specific patterns (i.e., triangle ascending), which are ripe for breaking out, and then report them to its users.
Hence, using Tickeron, you will be able to find hidden lucrative trading opportunities that most market participants overlook and profit handsomely from them.
Onboarding Process
Using Tickeron is straightforward. There are four steps that you need to do:
Step 1: Select the type of securities you need: You can choose from the following: stocks, ETFs, cryptocurrencies, and FX. However, penny stocks will NOT be available for real-time screening.
Step 2: Select the type of patterns: There are 39 bullish and bearish patterns in total. Most of which are popular ones, such as “Cup-and-Handle, Rising Wedge, Triple Bottom, etc.
Step 3: Specify minimum confidence level: AI will perform calculations to determine the chance that the pattern will conclude as predicted. Hence, you will need to choose the minimum confidence level for AI to find suitable opportunities that fit your risk profile.
I suggest setting this number to be 50% to filter out all trade ideas that are unlikely to be lucrative and curb the list to manageable levels.
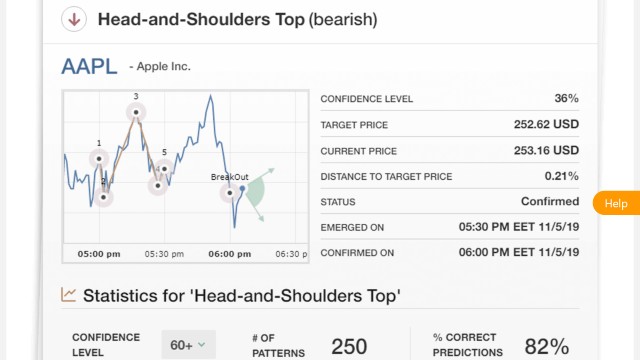
Soon, Tickeron will report all trade ideas it can find. Each report will include
- An annotated chart showing the stock where the pattern is being formed, plus its current status
- Current confidence level
- Entry and exit prices
- Relevant statistics such as the previous success rate of the pattern from backtesting
The best part is you can choose the timeframe independently. For example, Tickeron can find stocks forming cup-and-handles in both 5-minute and daily charts. Therefore, the tool is helpful for day traders, swing traders, mid-term traders alike.
Caution!: Even though AI may show promising results, you should not blindly believe the reports and make trading decisions without analyzing the pattern manually. This mistake could cost you thousands of dollars or even more.
Other Features
Stock Screener – Tickeron can scan the market for stocks that fit your selected criteria fundamentally and technically. I personally appreciate the report as it is exceptionally informative and effortless to read.
My favorite part is that Tickeron will automatically calculate the odds for trend continuation based on backtesting and statistics for each technical indicator.
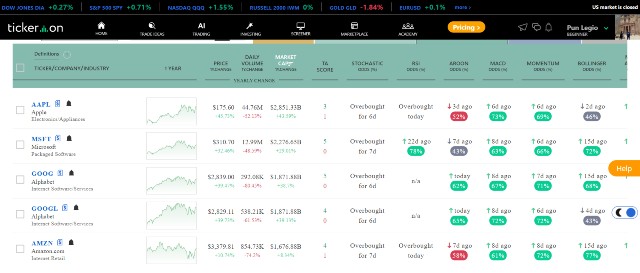
In other words, Tickeron will perform backtesting on the MACD for AAPL. It may find out that in 54 out of 78 past instances, AAPL will continue the rally if the MACD crosses above zero. Thus, the odds of a trend continuation are 54/78 = 69%, which can be a decent indicator of the success rate.
Also, each specific stock has its own unique page, which you can read to learn more about the stock and perceive Tickeron’s near-term prediction of support and resistance.
AI Trend Prediction Engine – AI will predict the trends and performance of specific securities and inform you about them. This feature is beneficial if you want a second opinion to support or contradict your analysis.
Tickeron reveals the accuracy data for this tool on its site. Based on this data alone, AI seems to be right 60%-70% of the time. I would say AI is pretty accurate and modestly reliable.
AI Robots – Tickeron can function similarly to automated trading software. Specifically, AI will search for trading opportunities throughout the markets (based on your chosen trading strategy) and report the selected results.
From an overall perspective, Tickeron is a platform with numerous valuable chart analysis tools. All of which are useful in identifying and evaluating trading opportunities and offer unique insights.
However, Tickeron is not without drawbacks. Its AI makes frequent mistakes, and some of the terminologies used on the platform are unique to Tickeron. This can confuse new users.
Still unsure whether Tickeron is right for you? Start a 14-day free trial to test all of its features for free.
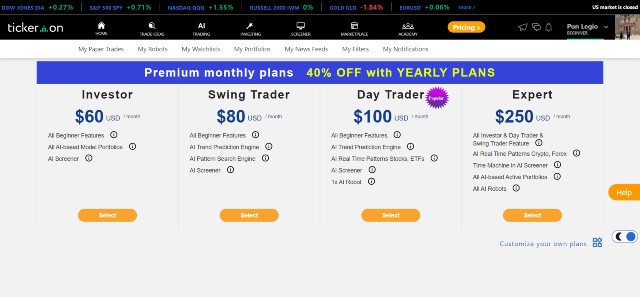
Pricing
Currently, Tickeron offers four pricing plans as follows (billed annually):
- Investor – starting at $36 per month
- Swing Trader – starting at $48 per month
- Day Trader – starting at $60 per month
- Expert – starting at $150 per month
You will need at least the Swing Trader plan to use Tickeron’s AI pattern prediction engine. However, you cannot use AI to search for patterns in real-time. You will get your results at the beginning or end of the trading day.
Hence, if you are a day trader, I suggest adding $12 per month and subscribing to the Day Trader plan. You will get a real-time pattern prediction engine for stocks and ETFs, a stock screener, and a trend prediction engine. All of which are worth far more than the additional money fees you will pay.
Suppose you also engage in cryptocurrencies and Forex trading. In this case, investing in an Expert plan would be wise. This plan will grant you access to all AI tools on the Tickeron platform.
Pros & Cons
Pros
- Equipped with various tools to smoothen chart and trade analysis
- All AI predictions are based on statistics.
- Support various financial securities, ranging from stocks and ETFs to Forex and cryptocurrencies
- Fairly easy to use
- One of the few reliable pattern/breakout detection tools available
- Informative stock screener
- Web-based: the software is accessible from any device.
Cons
- Despite showing promising results, AI is not 100% reliable. A manual review is always required.
- Some terminologies used in the platform are confusing.
Other Alternatives
Stockcharts – Stockcharts is the technical analysis software I used back in 2010 before being introduced to TradingView. In 2022, the platform is still reliable and helpful. However, its functionalities cannot match that of new tools. The UI is very outdated (no changes from 2010).
TC2000 – TC2000 is another platform that offers several robust features that help you analyze charts. Unfortunately, it lacks the advanced charting tools of other platforms.
Best Free Technical Analysis tools?
All brokerages typically offer decent technical analysis tools for clients to use for free. However, the quality of the tools can be wildly different. In my case, I found the one provided by Interactive Brokers is far better than that of my previous brokerage.
Furthermore, there are other free technical analysis tools over the internet. Several stock market websites (such as Yahoo Finance or Seeking Alpha) would provide essential tools that you can use for free. However, the features are insufficient even for an average trader.
Therefore, if you don’t want to invest in paid technical analysis tools, I recommend sticking to TradingView. There are no other free platforms that offer that many features and simplicity.