For novice or professional investors alike, stock research tools are a must-have asset in one’s investment journey. They can help you save time and effort in carrying out your investment analysis at a cheaper cost.
However, there are so many stock research tools, websites, and platforms. It isn’t easy to know where to begin or which one is the right one for you, as different tools have different approaches.
Some tools help investors conduct value-based analysis, while others pinpoint finding trading signals based on technical analysis.
Furthermore, not all stock research tools are affordable for retail investors. Top ones used by institutional investors such as Bloomberg Terminal could cost as high as $2,500 or even more per month.
Thus, this post will solve this problem. The list will include only the best stock research tools for both fundamental-based investors and technical traders. These tools are perfectly affordable for retail investors and provide good value for money.
Things You Should Know
Why Do You Need a Stock Research Tool?
Many new traders and investors may wonder why I need these stock research tools. They often ask: “My stock brokerage has provided me with some tools that I can use for free. Why do I need to pay extra for these tools?”
The reason is that almost all brokerage tools are too rudimentary. There are very few beneficial features that help you in conducting research.
Stock research tools that I will recommend are another story. They provide a lot of in-depth data that can help you analyze financial performance and charts and evaluate risk and reward.
All of them possess stock scanners that you can use to find excellent investment opportunities. Some of them even have a real-time tracker that helps you become aware of the hot news much faster than fellow traders.
As a hybrid investor who utilizes both fundamental and technical analysis, I am always fond of using these tools.
They help me reduce time spent on stock research by hours, alleviate the pain of googling endlessly for data and news, remove the need to create financial models on Excel, and provide me infinite stock investing or trading opportunities.
As a result, I have more leisure time to spend with my family and make much more money than the subscription fees for the tools.
Post Structure
To assist you further, I decided to break down this post into two parts.
The first part will focus on the best stock research tools for fundamental-based investors, such as those that adhere to value investing methodology.
The second part will discuss top tools for day traders and chartists.
You can then find the right, affordable stock research tool that matches your investing or trading strategy with ease.
Affiliate Disclaimer: This post from Victory Tale contains affiliate links. We will get a small commission if you subscribe to these stock research sites through our links.
As we always value integrity and prioritize our audience’s interests, you can rest assured that all products and services mentioned in the post are discussed truthfully.
Best Stock Research Tools For Long-Term Investors
Below are the best stock research platforms for those who utilize fundamental analysis in their investing strategy.
For example, you can use them to find high-quality companies sold at a reasonable price or a “cigar-butt” stock sold far below its intrinsic value.
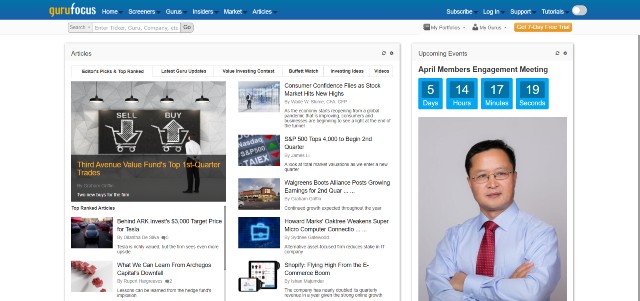
1. Gurufocus
If you are a value investor or a growth investor who wants to find top stocks based on their financial performance, I think Gurufocus is unarguably one of the best stock research websites you could find online.
The company has been guiding investors in stock research for almost two decades. I have been using the tool since 2011 (I switch back and forth between free and premium), so I am very confident in recommending it to you.
Key Features
Gurufocus has numerous stock-related features on its platform. All will assist you in screening stocks, evaluating their financial performance, building various financial models, and many more.
Below are the key features of Gurufocus.
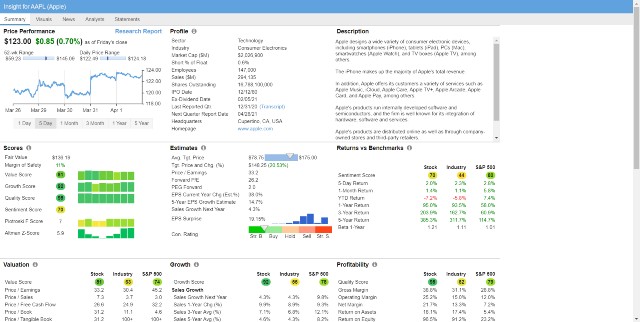
Stock Summary – This core feature will provide data for every specific stock, including business description, financial strength, profitability rank, fair value based on various valuation methods, news, insider and institutional ownership, and many more.
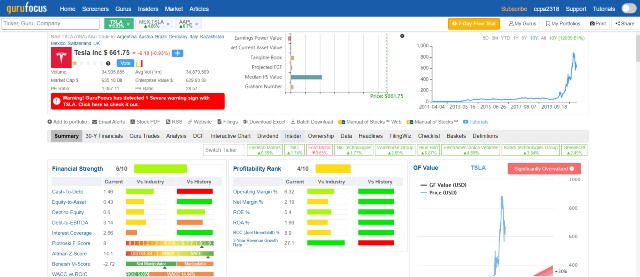
All of this data will be on a single page and beautifully visualized. You can also see how each financial metric compares with those of competitors and obtain a good understanding of the stock within minutes.
30-Years Financial Data – This one is my favorite feature. Unlike other tools that provide only 5 or 10 years of financial data for each stock, Gurufocus offers as many as 30-years of financial data (if available) extracted directly from SEC reports.
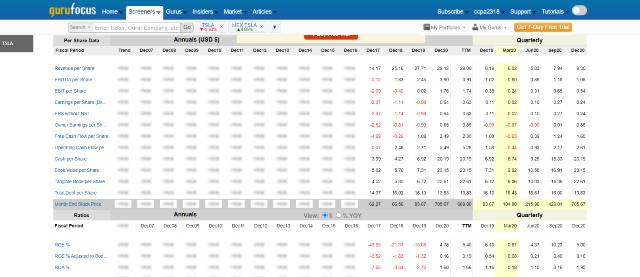
Thus, using this feature makes it effortless for investors to evaluate any company’s stability and long-term trend, notably those that pay hefty dividends.
Interactive Chart – It is tedious to analyze financial data without data visualization. This feature allows you to create an interactive chart to visualize the data for easier understanding.
DCF Calculator – This feature allows users to find the fair value of the stock by using a discounted cash flow model within seconds. Gurufocus will automatically supply the necessary data, so you don’t need to input it manually.
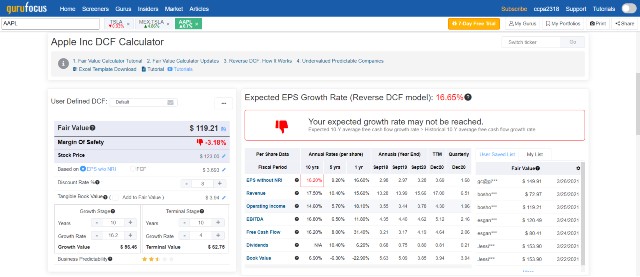
However, you can still make changes to the growth rate or the discount rate to create a possible fair value range, which you can compare with the current stock price to see whether the stock is undervalued.
I like this feature, as it saves me hours of tediously creating a financial model on Excel.
Stock Screening Tools – Gurufocus has more than 50 types of stock screening tools for users to choose from.
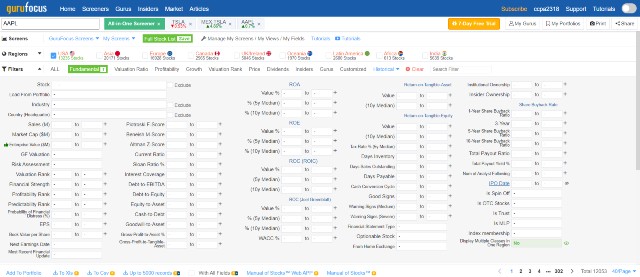
You can create one on your own by setting preferred conditions and parameters or use the pre-made ones that will find “good stocks” according to popular methodologies such as those of Peter Lynch and Warren Buffett.
Based on my experience, these tools are among the best stock screeners that retail investors can afford. The only tools that beat Gurufocus’s stock screeners are Bloomberg Terminal and Reuters’ Eikon (I used both when I was in college and worked as an equity research intern), which are a hundred times more expensive.
Warning Signs – Gurufocus will automatically detect warning signs that may indicate a deterioration in each company’s financial performance. I find this feature beneficial as it might inform me of what I missed in the due diligence and stock-picking process.
Market Valuation Tools – Gurufocus has several market valuation tools that you can use to assess the stock market’s current health. These include the Buffett Indicator, Shiller P/E, Treasury yield curve, and many more.
Such tools can be extremely useful in speeding up your top-down research process.
Guru Trades – This feature allows you to track top institutional investors such as Carl Icahn, David Tepper, Warren Buffett, and George Soros and learn which stocks they buy or sell for their portfolios.

I have not used this feature much. However, it may be helpful for those who want to utilize the wisdom of professional investors.
Furthermore, traders who want to find individual stocks with high institutional accumulation or event-driven investors might find this feature beneficial.
Pricing
How much Gurufocus costs will depend on the number of regions you need. Below is the yearly pricing for each region (Gurufocus does not offer monthly subscriptions.)
- US – $449 per year
- Asia (Excluding India and Pakistan) – $399 per year
- Canada – $289 per year
- UK/Ireland – $269 per year
- Oceania – $269 per year
- Latin America – $299 per year
- Africa – $249 per year
- India/Pakistan – $249 per year
If you subscribe to more than one region, there will a 10%-20% discount, depending on how many regions you add.
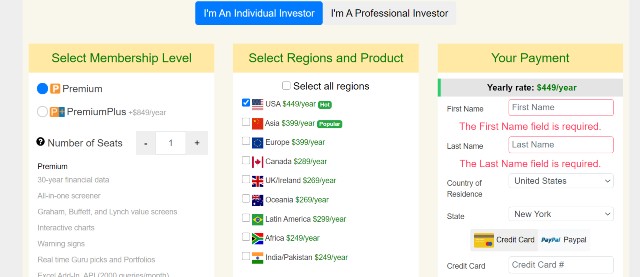
After subscribing, you can get all the key features for that region. Still, you can pay $849 per year to gain access to extra features as follows.
- Backtesting
- 13F/13D/13G of institutional investors
- Manual of Stocks (printable research reports for every company)
- FilingWiz
- 20,000 API queries (compared to 2,000 for the regular plan)
However, I don’t think these extra features are necessary. Key features included in the standard plan are more than adequate for investors to perform stock research efficiently.
Pros and Cons
Pros
- Unarguably one of the best stock analysis websites for individual investors
- Provide tons of in-depth fundamental data for each stock
- All features come with highly detailed explanations, so anyone with some investing knowledge will have no difficulty using them.
- Beautiful data visualization
- Excellent numerous analytical tools to help investors in financial modeling, find the fair value of the stock or perform comparative analysis
- 50+ stock screeners to choose from, unarguably one of the best stock analysis software that retail investors could afford
- In-depth insider trading, institutional ownership, and guru trading data
- Cover global stocks
- Useful market valuation tools
- Downloadable data (Excel files)
- 30-day money-back guarantee
Cons
- Gurufocus is an old-school stock research website, so the user experience is not up to current standards.
- The immense amount of financial data is severely cluttered and can overwhelm new investors.
- Starting a free trial requires a credit card
- No monthly plans
You can sign up for a free account to use the basic features on the platform. Alternatively, you can start a 7-day free trial to get the complete experience.
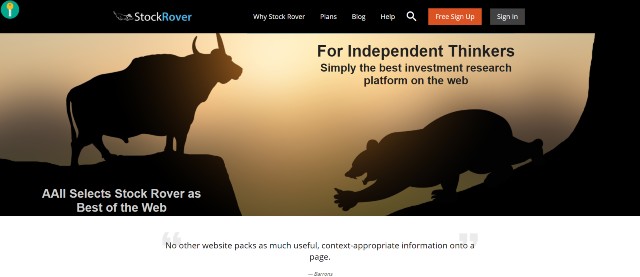
2. Stock Rover
Stock Rover is a stock research tool with affordable pricing. The tool helps investors find excellent opportunities in the U.S. stock market to invest successfully.
Key Features
Stock Insights – This feature on the Stock Rover platform provides an overview of the financial data of each stock, including business descriptions, growth, profitability, financial health, analyst estimates, and many more.
The data presented here is not as informative as that of Gurufocus. Nevertheless, they are much easier to read and understand.
Research Report – Stock Rover users can view research reports of any stock in the US Market. The report is an extended version of stock insights.
You will get more data for each component, such as valuation, growth, financial health, peer analysis, analyst consensus, financial statement summary, and many more.
The platform will compare these data with those of that stock’s competitor and S&P 500, so you can conduct a comparative analysis with ease.
Everything is 100% readable, well-structured, and straightforward. Nevertheless, Stock Rover does not show how it calculates the fair value, making it less reliable.
Stock Screener – Similar to Gurufocus, Stock Rover allows users to create their own metrics or use pre-made ones. The latter will list stocks that fit popular criteria such as Growth at a Reasonable Price, Relative Strength, or Dividend Growth.
I like this stock screener because it directly displays all essential data, so I do not need to open the research report on each stock separately, saving plenty of time in the process.
Built-in Portfolio Tools – Besides stock research tools, Stock Rover has built-in portfolio tools that you can utilize to manage your portfolio. These tools can connect seamlessly to your brokerage account.
With these tools, you can analyze, rebalance and find the correlation among stocks in the portfolio to diversify risks and optimize rewards.
Alerts – You can set up alerts for Stock Rover to notify you in case an event of interest occurs.
Pricing
Stock Rover offers a three-tier pricing plan for its customers as follows: All pricing is for yearly plans. However, a monthly and a 2-year plan are also available for subscription.
- Essentials – $79.99 per year
- Premium – $179.99 per year
- Premium Plus – $279.99 per year
All plans will have access to data of 8,500+ North American stocks, 4,000 ETFs, and 40,000 funds. However, higher plans will provide more financial metrics on insights, research reports, and stock screening tools.
For example, you can view stock ratings and the fair value only if you subscribe to the Premium Plus plan.
If you want to use Stock Rover, you might want to subscribe to the Premium Plus plan. Otherwise, this stock research platform is much less beneficial.
There are also better alternatives to the Essentials and Premium plan that provide more comprehensive financial data and analysis at the same pricing.
Pros and Cons
Pros
- Affordable pricing
- Clean user interface
- Simplified financial data with explanations, thus suitable for new investors
- Easy-to-use stock screener
- Include built-in portfolio tools
- Integrate seamlessly with your brokerage or trading platform
- 14-day free trial with no credit card required
Cons
- Lack of complete financial statement data
- Do not show how it calculates the fair value of a stock
- Limit usable financial metrics on low-tier and mid-tier plan
3. Morningstar Premium
Morningstar Premium is another tool that I am always fond of. The platform’s simplicity and reliability have won the hearts of many investors, including me.
Though Morningstar’s site has gone through several refurbishments since I first used it in 2011, I still believe it is one of the best stock research tools a retail investor could find now.
Key Features
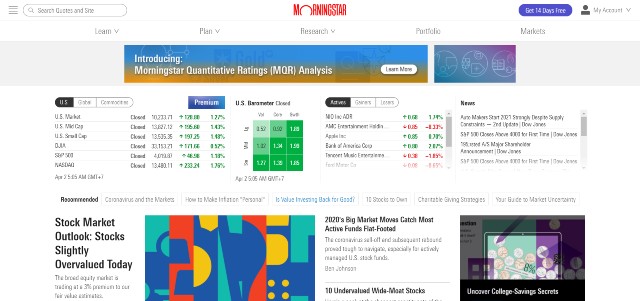
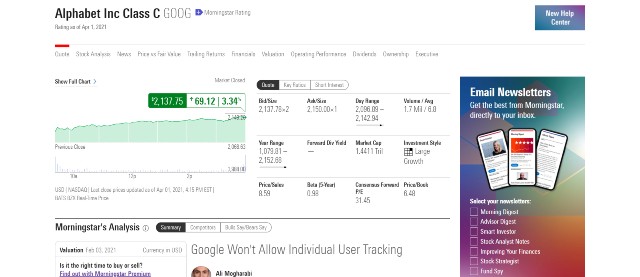
Unlike all other stock research tools, most of the financial data on the Morningstar platform is accessible for free.
You can view each stock’s detailed valuation (price-to-earnings ratio and the like), operating performance (earnings per share. etc.), profitability, dividend records, and institutional ownership, and many others.
This is one of the reasons why Morningstar is always one of my favorite tools.
Morningstar Premium will improve the capabilities of the platform to help you make better investment decisions. The extra features are as follows:
10-Yr Full Financial Statement – You can comfortably view each company’s total 10-year financial statements on the Morningstar platform. Exporting the data to Excel is also effortless.
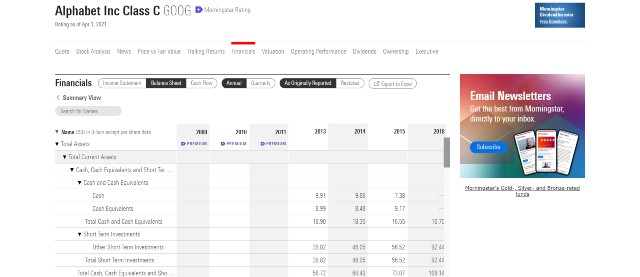
Unfortunately, I found out that only the balance sheet is viewable. I cannot access the other two. This feature used to work, but now it is not.
Analyst Reports – Morningstar research analysts will provide an independent assessment of thousands of U.S. stocks. You will get stock ratings, the fair value of each stock, and comprehensive stock analysis for large-cap and mid-cap stocks.
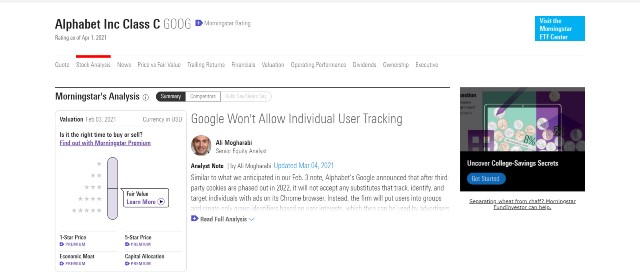
I found these reports beneficial as investment advice. Though they are not as detailed as regular research reports written by analysts at top investment banks such as Goldman Sachs, these reports are high-quality and insightful. You can think of them as your stock advisor.
The drawback is that Morningstar analysts do not cover the majority of stocks in the U.S. market. If you are interested in small-caps, this feature will be of no use.
Top Investment Picks – This feature provides access to the best stocks, ETFs, and mutual funds chosen by Morningstar analysts. You can handily select suitable investments based on your financial goal.
Portfolio Manager/X-ray – You can create a portfolio on the platform and use several tools to analyze it to ensure it is adequately diversified and generates optimized returns.
Screeners – You can find the best stocks, ETFs, and mutual funds (index funds included) by using the screener. Like other tools, you can set your personalized parameters from hundreds of financial metrics or utilize pre-made screeners.
I found the screeners to be decent. It does show some good results, but I think Gurufocus’ is much better.
Article Archive – You will gain access to an extensive library of articles written by Morningstar analysts. If you are a new investor, it may be a good idea to read them to expand your knowledge in equity markets and stock picks.
Pricing
Morningstar has a simple pricing structure. The premium plan costs $29.95 per month or $199 per year. There is also a two-year plan ($349) and a three-year plan ($449).
You can try Morningstar Premium for free for 14 days. However, you will need a credit card to start a free trial.
Pros and Cons
Pros
- Access various financial data for free
- Reliable stock/mutual fund ratings, analysis, and fair value calculation
- Excellent portfolio tools
- Good stock screeners
- Reasonable pricing
- Clean and easy-to-use investment research platform
- Provide several learning materials to help novice investors find starter stocks for their portfolio and enhance
Cons
- A 14-day free trial requires a credit card.
- 10-yr income statement and cash flow statement are not viewable.
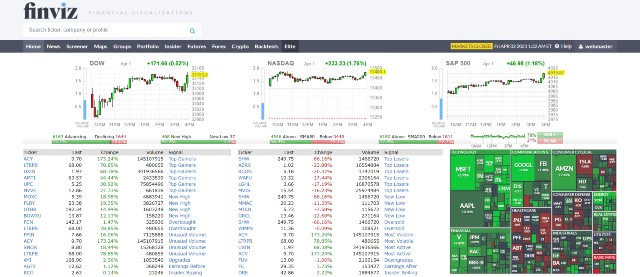
4. Finviz Elite
Finviz is a freemium financial visualization website, which turns out to be an excellent stock research tool for those who utilize either fundamental or technical analysis.
If you are looking for a reliable tool to help you with stock picking, Finviz should be on the radar.
Key Features
Similar to Morningstar, Finviz allows users to use tools and access data sets for free. This includes 3-year financial statements, portfolio tools, and basic stock screeners. I still have not used Finviz much as there are many annoying ads on the platform.
However, if you want a complete stock research tool and to get rid of those ads, you will need to subscribe to its premium service, Finviz Elite.
Below are the key features of Finviz Elite.
Enhanced Stock Screener – Finviz’s enhanced stock screener can create an in-depth screening of U.S. stocks. You can choose from more than 50+ metrics from both the fundamental and technical sides.
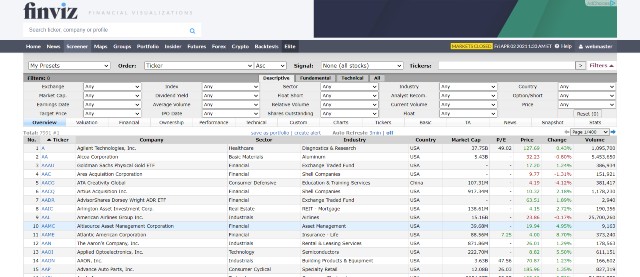
The best thing here is that Finviz will display detailed data on the stock screener. You do not need to click on each stock individually to view the analyst’s recommendations or P/E Ratio, as all necessary data is already viewable.
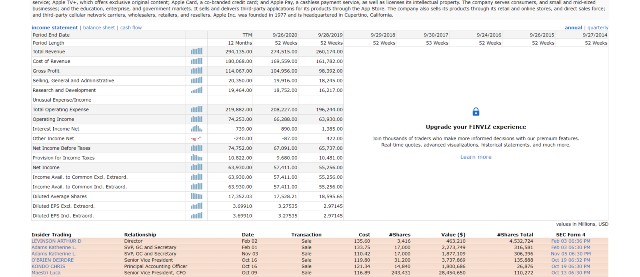
8-Year Financial Statements – Finviz Elite provides complete 8-year financial statements for each stock.
Technical Charts – You can use Finviz Elite to analyze charts. The plan includes intraday charts, indicators, drawing tools, and performance charts for users to find trading opportunities.
Real-time and Extended Hours Market Data – All Finviz Elite users will gain access to real-time data for regular, pre-market, and after-hours trading sessions.
Fundamental Charts – Similar to Gurufocus, Finviz Elite can create an interactive chart for fundamental data. You can see how the company’s revenue or earnings per share grow or plunge over time.
Backtesting – This feature helps traders evaluate their trading strategies based on 16 years of historical pricing data. Hence, you will not lose money on poor strategies.
Alerts and Notifications – Finviz Elite can send alerts and notifications to inform you about changes in stock price, new stock in screener criteria, or the occurrence of significant events. You can completely customize the conditions for alerts to be triggered.
Pricing
Finviz Elite costs $24.5 per month for the yearly plan, while the monthly plan will cost as high as $39.5 per month. After subscribing, you will be able to use the platform with no ads and limitations.
Pros and Cons
Pros
- Many financial data is accessible free of charge.
- Access real-time market data for regular, pre-market and after-hours sessions
- Backtesting is beneficial for weeding out poor trading strategies.
- Excellent stock screener
- Good fundamentals and technical charts
- Downloadable data for further due diligence
- 30-day money back guarantee for Finviz Elite subscription
Cons
- The free version has ads everywhere.
- Clunky website (similar to those from the 2000s.)
- No free trial for Finviz Elite
Best Stock Research Platforms for Short-Term Traders
Next, I will discuss stock research platforms for short-term traders who use technical analysis.
These tools possess excellent interactive charts with numerous indicators to help traders time the market and a powerful scanner that automatically finds stocks with trading opportunities.
5. Benzinga Pro
Benzinga Pro is an excellent tool usable by both fundamental-based investors and traders who employ technical analysis alike.
However, I think its strengths lie in its real-time stocks newsfeed, market movers, and signals, so I decided to put it in this group, as day traders and technical traders might find these features more helpful.
Key Features
Newsfeed – Fast news and information are essential for short-term trading success. Benzinga Pro reports these news articles in real-time, so you will always be up-to-date.
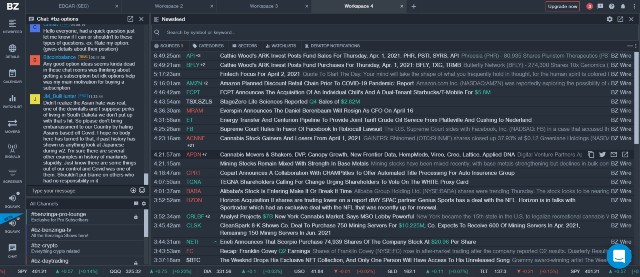
The best thing about this feature is that each headline is colored red or green, displaying a sentiment that may move stock prices downward or upward. Thus, it is much easier for users to perceive information.
Why Is It Moving (WIIM) – Traders are always confused about why stocks move in a peculiar or even unreasonable way. This feature will send a one-sentence description to help clarify.
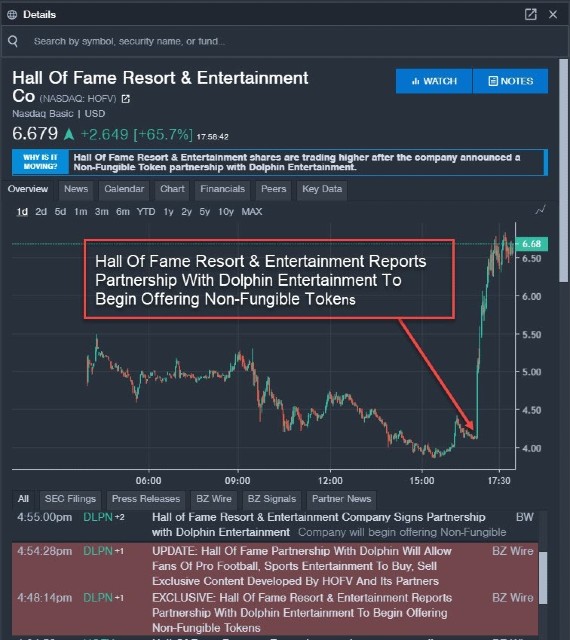
WIIM is part of the Newsfeed. You can easily find it at the top of the Newsfeed column or search for them directly.
Push Notifications and Alerts – Benzinga can send push notifications, so a stock trader like you can never miss an event, even if you have already switched tabs or windows.
Additionally, Benzinga Pro can send sound alerts or email notifications, which can quickly get your attention.
Movers – If you are day traders and swing traders, you cannot make a living without volatility. Thus, Benzinga Pro will help find the biggest winners and losers on the stock market in the chosen timeframe.
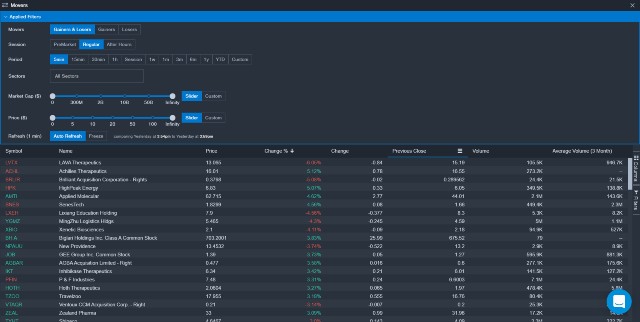
You can then click on each result to see which news affects the stock price.
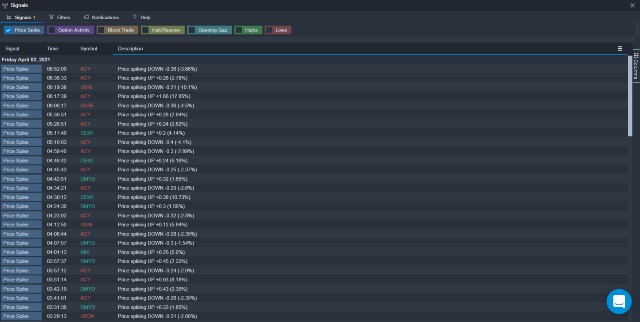
Signals – These tools help you keep track of significant price-volume events on the stock market. You can track price spikes, opening gaps, block trade, options activity, and many more.
Audio Squawk – This audio news broadcast will inform users about various types of news that affect the stock market, including economic data releases, corporate conference calls, earnings guidance, and even market rumors.
I think this feature is useful. It can help you regain focus after being distracted by something else.
Screener – Benzinga Pro’s stock screener allows users to insert specific criteria to find the stock of their interests. Unlike most stock research tools, you can input both fundamental and technical metrics into the screener, making it useful for all traders and investors.
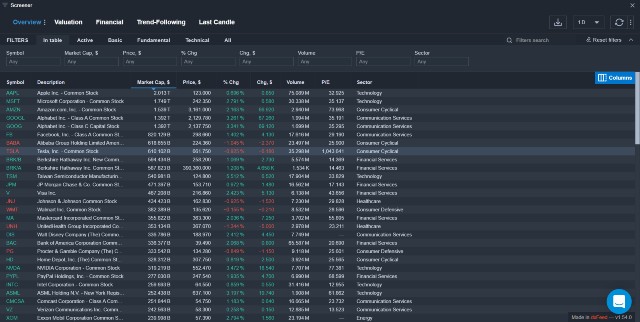
Nevertheless, the screener has no pre-made templates. You will need to input all parameters into the screener on your own.
Charts – Benzinga Pro allows users to analyze stock charts directly on the platform. You can draw trendlines, insert Fibonacci retracement or add popular indicators such as the MACD to make trading decisions.
Fundamental Data – Benzinga Pro provides a summary of each stock’s fundamental data, including key ratios (i.e., price-earnings ratio), pricing data, business descriptions, peer comparisons, dividends, etc.
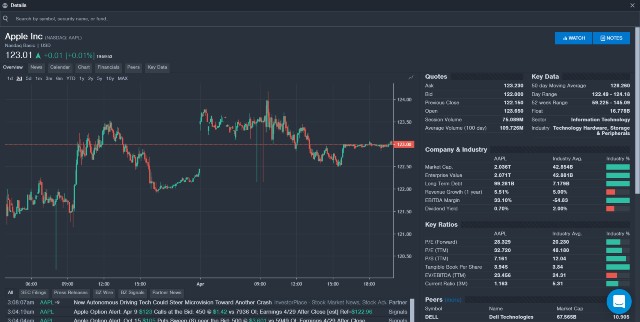
If needed, you can also its complete financial statements directly on the platform. However, as of April 2021, I think only quarterly financial reports are available.
However, my favorite part of this feature is that it allows users to access each stock’s SEC filings directly, so I don’t need to spend time on the SEC’s website searching for 10-Qs or 10-Ks.
Calendar – Benzinga Pro also provides a calendar for each stock. The calendar will display past and upcoming dividend payments, earnings reports, guidance, a timeline of analyst upgrades & downgrades, and many more.
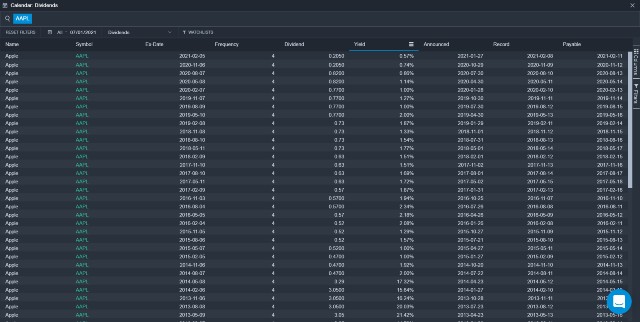
I like the Calendar, as it allows me to track the activities of the companies I own stocks with ease.
Customization – Almost everything on the Benzinga Pro platform is customizable. Thus, you can use your self-made parameters to filter out news and activities you are not interested in.
You can request a demo version or start a 14-day free trial to try Benzinga Pro.
Pricing
Currently, Benzinga has a three-tier pricing plan as follows: All pricing below is for annual plans.
- Basic – $27 per month
- Essential – $117 per month
- Options Mentorship – $281 per month
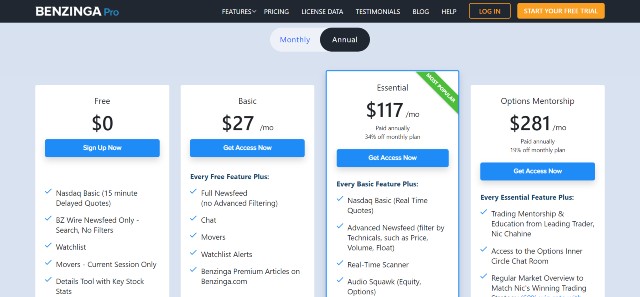
The Essential plan is the one that most traders should use. The reason is that the Basic plan does not provide real-time market data for NASDAQ stocks. It also lacks important features, including a stock screener, sentiment indicators, and signals.
The Ultimate plan adds exclusive options mentorship and an unusual options activity tracker to the Essential plan. However, both of which will not be very beneficial for a stock trader/investor to pay an additional $164 per month. This plan only fits those who trade both stocks and options.
Suppose you want to track unusual options activity to gain insights on specific stocks. Just subscribe to the Essential plan and get the add-on ($27.97 per month). This will save you more than $130 per month in subscription fees.
[sc name=”bgpro” ][/sc]Pros and Cons
Pros
- Unarguably one of the best platforms for active traders to access reliable real-time financial news articles.
- Excellent for day traders, good for long-term investors
- Beautiful, innovative, interactive platform, offering a wonderful user experience
- Fast and Effortless to use
- Many notifications to prevent traders from missing a significant event
- Good stock market research tools and sentiment evaluation engine
- The calendar helps users track corporate activities with ease.
- Totally customizable stock research tool
- Free 14-day trial with no credit card required
Cons
- The stock screener has no pre-made templates.
- The Basic plan does not gain access to real-time market data for NASDAQ stocks.
- No yearly financial statements
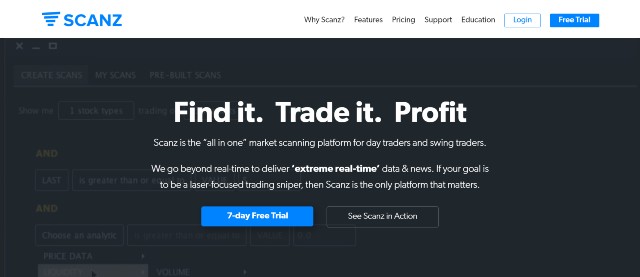
6. Scanz
Scanz is a specialized market scanning platform for day traders and swing traders. However, it turns out to be one of the best stock research tools, mainly if you use trend following and technical analysis as part of your trading strategy.
Unlike other tools, Scanz offers two completely different services: News and Scanner. You can subscribe individually to each one or subscribe to both for an extra discount.
Key Features (News)
This service is generally a news streamer, which is quite similar to Benzinga Pro. However, Scanz claims to provide “extreme real-time” data and news that could help you snatch lucrative trading opportunities.
Below are the features of the News service.
Real-time News Scanner – The scanner will collect data and news from more than 100 sources and providers, including wires, financial sites, and blogs.
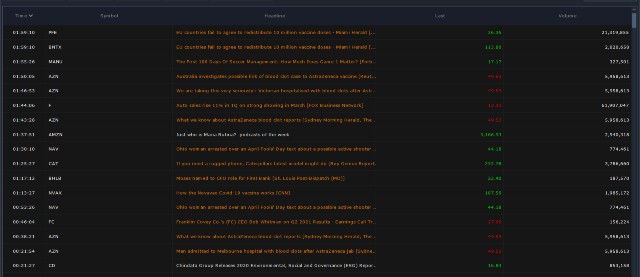
The blazing speed of the platform guarantees that you will always receive relevant market information in real-time, providing a first-mover advantage in trading.
Real-time SEC Filings – Earnings season could be highly profitable for many traders. Thus, it is vital to know the results before others. Scanz will inform you immediately when the data is out.
Alerts and Notifications – Scanz’s built-in notification system can send various types of alerts to inform you about important news, press releases, etc.
You can freely customize everything. For example, you can choose a notification method from these options: audio alerts, emails, SMS, or in-platform, and select which conditions must be triggered for Scanz to send an alert.
Montage – This dashboard is designed to provide an overview of an individual stock, including pricing data (pre-market, regular, after-hours), news, fundamentals, and times & sales.
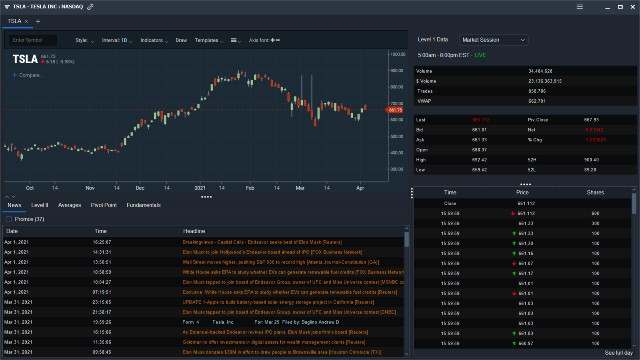
Streaming Charts – Scanz provides one of the best charting tools available. All charts are updated in real-time. You can then analyze the chart by using hundreds of indicators and other drawing tools.
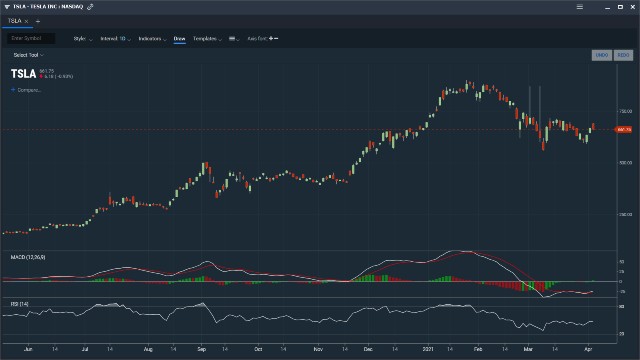
Key Features (Scanner)
Level 2 Data – The Scanner plan will provide access to both Montage and Streaming charts as the News plan. However, you can also take a glimpse at Level 2 data, while users of the News plan cannot.
Level 2 data is essential for many traders as they provide insights on the bigger picture and the actual demand/supply of the stock. As a result, it could prevent you from falling into a trap and help you make better trading decisions.
Stock Scanner – Scanz can filter stocks using numerous variables such as price, liquidity, technical, fundamental, and many others.
Most parameters that you can use as filters are mostly from the technical side. Still, interestingly, you can scan for a short squeeze candidate using “short interest” metrics.
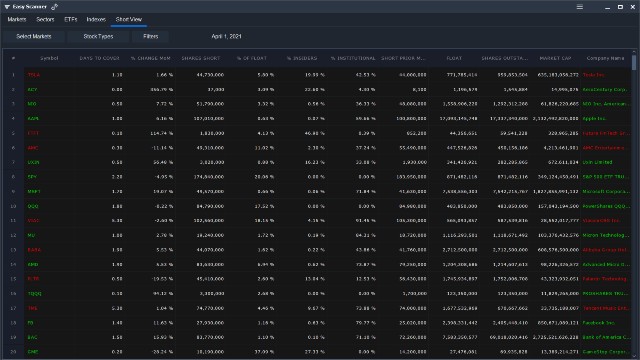
Unlike other tools, Scanz uses real-time data on the stock scanner, so you can be sure that the data is always up-to-date.
Scanz also plans to introduce pre-configured scans soon, which will automatically find stocks that create tradable pricing patterns such as gappers, moving average crossovers and dead cat bounces in real-time. Thus, you will never be devoid of excellent trading opportunities.
All results from the stock scanner are downloadable as a CSV file so that you can use your favorite spreadsheet software for further stock research.
Breakout Scanner – Those who trade using Jesse Livermore and William O’Neil’s strategy will be fond of this feature as it offers numerous breakout alerts on auto-pilot in real-time!
Scanz can track many types of breakouts, including new highs, new lows, price breakouts, and volume breakouts. You can even create a personalized breakout alert system according to your preferences.
Pricing
Scanz’s pricing is straightforward. The News plan costs $79 per month, while the Scanner plan costs $99 per month. If you want both, you can subscribe to the Total plan ($149 per month.)
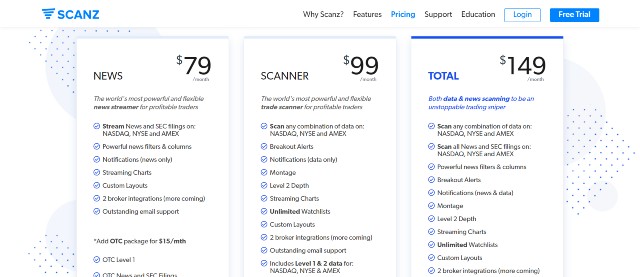
I think the Total plan is your best bet, as it includes all the features in the arsenal. You will get comprehensive trading tools that propel your advantage ahead of others.
There are no long-term contracts or obligations, so you can cancel the subscription at any time.
**Penny stocks traders can pay an extra fee of $15 per month to access the data for the OTC markets.**
Pros and Cons
Pros
- Unarguably one of the best stock research tools for those who use technical analysis.
- Extremely fast
- Stock scanners and breakout alerts are incredibly beneficial for technical traders.
- Provide access to level 2 stock quotes
- Various types of notification methods
- Integrate seamlessly with your brokerage
- Everything is customizable.
- No long-term contracts + Cancel at any time.
- 7-day free trial with no credit card required
Cons
- Full feature access is considerably more expensive than most peers.
- Not browser-based. You need to download the software and install it on your computer.
- No pre-built scans
- Fonts make it fairly difficult to read
You can try all the features on the Scanz platform for free for seven days (no credit card required.)
Other Platforms for Stock Recommendations
These platforms also help investors find stock ideas. However, I do not have first-hand experience, or I am not very satisfied with their services, so I chose not to include them in the list.
Motley Fool Stock Advisor – Motley Fool offers several premium services to customers. In other words, experts will provide stock recommendations to subscribers, so you do not need to research stocks on your own. The team claims their stock picks beat S&P500 by a fair margin (500% vs. 100% under the same period.)
The subscription fees start from $199 per year for the stock advisor plan. Still, it could be as high as $13,999 per year if you want exclusive access to all Motley Fool’s services.
Zacks – Zacks is a comprehensive investment research platform similar to Morningstar. However, I much preferred Morningstar as the data is much easier to read and understand.
Free Stock Research Tools and Websites
Seeking Alpha – Seeking Alpha is one of my favorite stock market websites. Many traders and investors create well-research articles on stocks and other assets that you can read for free.
I have obtained several profitable stock ideas from this platform. It would work best if you are an avid reader.
Google Finance – Back then, Google Finance used to be a much better tool. However, their developers removed most of the financial data from the platform. You can still view the pricing data and financial performance summary.
Yahoo Finance – Yahoo Finance is probably one of the best free stock research tools available. The platform provides an overview of each particular stock, including financial statements, analysts’ estimates, technical charts, and many more.
Related Posts
The following is a list of additional tools that stock investors and traders might find useful.
- Paid Stock Screeners
- Technical Analysis Software – If you rely on charts to trade stocks, this kind of software would be absolutely necessary as they can help you find thousands of more opportunities.
- Options Screeners – The big move in stocks is usually preceded by unusual options activities. Hence, a prudent trader may want to track such movements or actions as well.