So far, Google Analytics (GA) has been the most popular free web analytics tool. It provides website owners with insightful data about your site and its visitors.
Although the tool is free to use and potent, Google Analytics may not be the best option for many users. Below are some of the reasons.
- Google Analytics is not very beginner-friendly. Some of its metrics are very difficult to understand or analyze. You will need technical knowledge in marketing and website analytics to realize its full potential.
- You have to share your website data (and your visitors’ personal data) with Google and set up a cookie banner for your website. If you have privacy concerns, you may want to avoid using the tool completely.
- If you use a free account (as almost everyone does) and your web data is huge, Google Analytics can be inaccurate, as it utilizes data sampling for large data.
- Numerous Glitches! All website owners, marketers, and web developers are certainly familiar with such glitches that potentially ruin your marketing reports and web statistics.
That is why you should know about alternatives to Google Analytics (GA) that might better meet your needs.
In recent years, numerous users have shown interest in robust analytics solutions beyond Google Analytics. Undoubtedly, plenty of solid Google Analytics alternatives is available for users now.
I have prepared a list of the best Google Analytics alternatives (free+paid) for every website or company, regardless of their web traffic volume. You can then freely select the one that matches your preferences.
Affiliate Disclosure: This article from Victory Tale contains affiliate links. We will receive a small commission from software companies if you subscribe to their services through our links.
Nevertheless, we always value integrity and prioritize our audience’s interests. Therefore, you can rest assured that we will present all the products honestly.
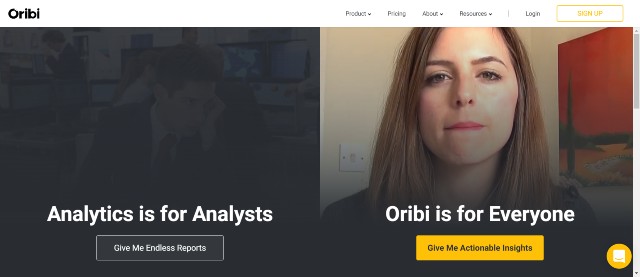
1. Oribi
Oribi is a premium Google Analytics alternative that provides automated actionable insights, which could save you time and resources in analyzing your website data.
If you are bored of analyzing abstract and complicated data on Google Analytics, Oribi is one of the best options you have.
Oribi has over a thousand clients, including globally recognized companies such as Panasonic, Sony, Pizza Hut, and AON.
Key Features
Insights and Trends – This is a core feature of Oribi and makes the tool stand out from Google Analytics and other analytics software.
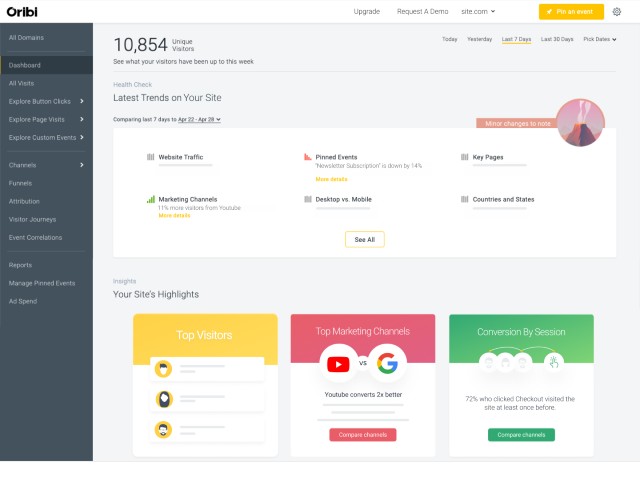
In addition to collecting your website data for manual analysis, Oribil will interpret it and provide insights for you automatically.
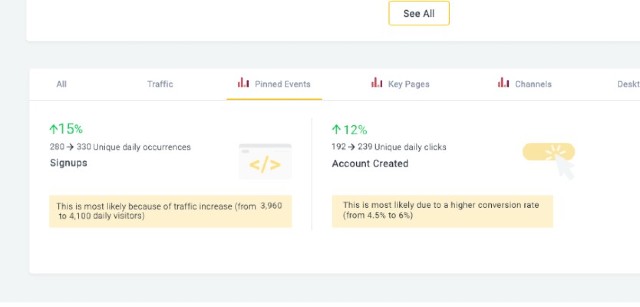
For example, if that week has more sign-ups, Oribi will show “the reason” near crucial metrics such as “more sign-ups on May 6th due to a popular post on LinkedIn” or “Traffic went up yesterday because your Google Ads performed better.”
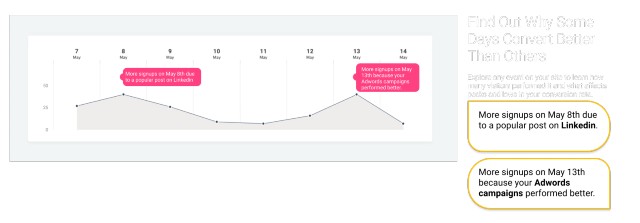
This feature is very beneficial as it smoothens the data analysis process. You don’t have to spend hours going over immense metrics to search fruitlessly for the hidden reason.
Since Oribi will instantly provide the actionable insights you are looking for, you can immediately save your campaign from catastrophe or add more budgets to optimize benefits.
Google Analytics does provide only essential insights. However, Oribi’s is much more in-depth and applies to all metrics on the platform, including customer behavior, acquisition, and many more.
Moreover, you will also get alerts when Oribi spots a new trend or significant changes in web data. Hence, Oribi users will always be up-to-date with current situations and make timely decisions.
Event Tracking – Oribi helps you track events on your website in a user-friendly way without the need to define anything manually.
As all events are tracked retroactively and automatically, you can look into the event of your interest in any timeframe whenever you want.
Furthermore, you can create new critical metrics by grouping these events. For example, you can group all events that direct users to the signup page together to evaluate the efficiency of your Google Ads campaign.
Best of all, if a new type of event appears, Oribi’s algorithms will send it to the most suitable group, eliminating the need to make changes as you have to in Google Analytics manually.
Smart Funnels – You can create smart funnels within a few clicks to discover which part of the customer journey is ineffective or even defunct in handling prospects.
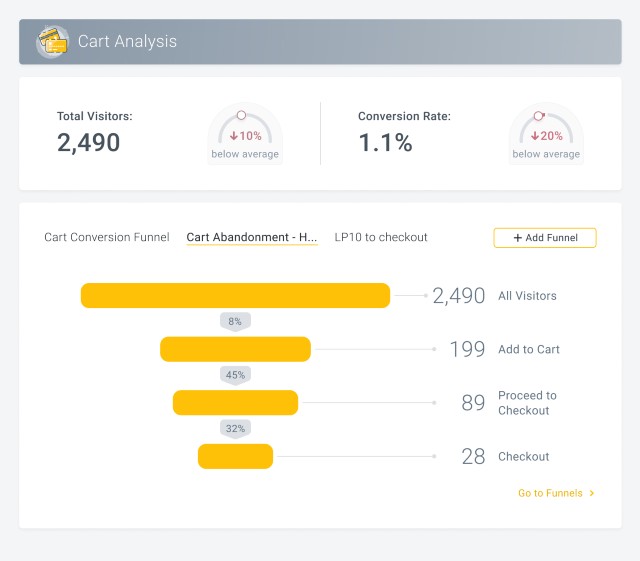
I found creating funnels on Oribi much more straightforward than Google Analytics. You can complete the process in a few clicks.
Similar to web analytics, you can see automatic insights on smart funnels. Hence, you do not spend time analyzing all data on your own.
Correlations – This feature makes Oribi your personal assistant. You can ask Oribi whether a particular factor may affect the conversion rate. Oribi will answer your inquiries based on the collected statistics.
For instance, you can ask Oribi whether viewers of product videos are more likely to buy. Oribi will respond with “Yes” or “No” and include referenced data.
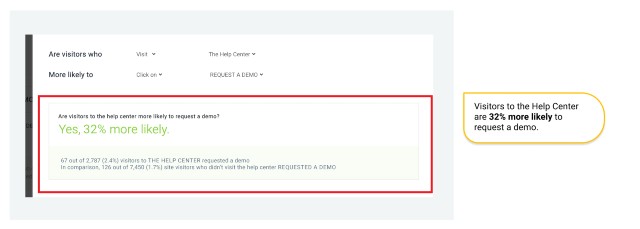
This feature may sound simple but amazingly helpful. It can help you make better decisions for your website and marketing campaigns.
Visitor Journeys – This feature essentially allows you to follow each user on your site and grasp user behavior, including actions, pages opened, acquisitions, and other valuable metrics.
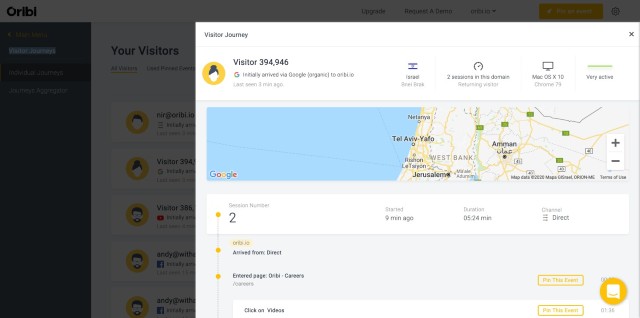
You can also add an email integration to identify visitors, which will help you create a personalized experience for them and find top prospects.
Custom Reports – Oribi has a built-in report builder that can generate a professional-looking report for your clients or supervisors within a single click. You can customize everything by adding a logo or changing the background color to make it 100% your own.
Attribution – You can use this feature to identify the source of customer actions handily. You will notice multiple touchpoints that every visitor has before performing a specific action on your site.
Hence, you can utilize this data to optimize your marketing campaigns. You will find the best channels for each part of the user journey, such as Facebook Ads for raising awareness and Google for generating conversions.
Pricing
Oribi’s pricing structure is quite complicated. However, I will try my best to explain it.
As of May 2021, Oribi has different pricing plans for client types (Business Website, eCommerce Shop, and Marketing Agency.)
Below are the pricing plans for each client type (all pricing is for annual plans.)
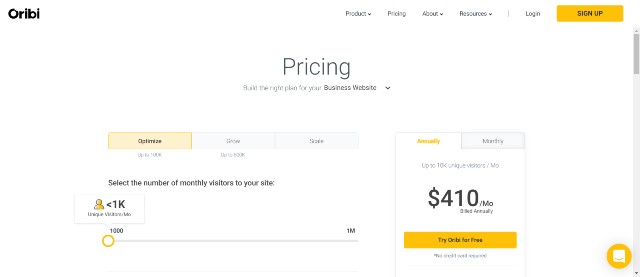
Business Website
- Optimize – starting at $410 per month for 10,000 unique visitors
- Grow – starting at $492 per month for 10,000 unique visitors
- Scale – starting at $820 per month for 50,000 unique visitors.
eCommerce Shop
- Optimize – starting at $328 per month for 10,000 unique visitors
- Grow – starting at $410 per month for 10,000 unique visitors
- Scale – starting at $738 per month for 50,000 unique visitors.
Marketing Agency
- Oribi has only one plan, which starts at $615 per month for 10,000 unique visitors. This plan has all the feature access (similar to the Scale plan.)
Besides the plan, the monthly fee also depends on the size of the unique monthly visitor quota. For instance, you will pay $656 per month for the Optimize plan if your website receives no more than 50,000 unique visitors monthly.
However, the Optimize plan can only be used with a website with no more than 100,000 unique visitors, while this number is 500,000 for the Grow plan.
If your website visitors exceed that limit, there are no other options besides upgrading to a higher plan.
Optimize plan users will gain access to almost all the features. However, their data retention period is only six months. In addition, they cannot export events to your advertising channels such as Facebook and Google Ads.
Grow plan users have a more extended data retention period of 1 year and can export events, but they cannot create white-label reports (only available for Scale plan users.)
All plans have access to 1:1 onboarding, webinar, and conversion optimization experts who will call you once a month to provide valuable tailored suggestions for your website.
I suggest starting with the Optimize plan for bloggers and content marketers as I don’t think additional features on higher plans will benefit you much.
However, eCommerce owners may want to subscribe to the Grow or Scale plan to export events to advertising channels and have up to 2-year data retention to evaluate an entire fiscal year appropriately.
My Evaluation
Apparently, Oribi’s price tag is much higher than most Google Analytics alternatives in this list. As a result, many may wonder if Oribi is worth such a hefty investment.
For me, the answer is both “Yes” and “No.“
Oribi differentiates itself from other web analytics tools mainly by delivering instant actionable insights, saving you time and resources.
If your website is small, your data will be more manageable. It would not be too troublesome to use other free or inexpensive tools and analyze them on your own. Hence, in my opinion, it would be best if you invest your budget elsewhere.
In contrast, those who have a large eCommerce website or SaaS business, but suffer from low, unexplained conversion rates, might want to give Oribi a try.
Oribi can serve as your reliable virtual business intelligence analyst to uncover hidden insights and offer promising solutions. It also helps reduce the workload of the marketing team and the need to hire a full-time data analyst for your business.
Hence, at $400-$500 per month, I think the tool is 100% worth subscribing to.
If you are convinced, you can try Oribi for free for seven days.
Oribi vs. Google Analytics
Google Analytics is better on
- Longer data history (26 months vs. 6-24 months for Oribi)
- More in-depth data
- Testing and other advanced features
- Free usage for life
- Mobile Apps
Oribi is better on
- Clean and fast dashboard
- Automatic in-depth insights
- More accurate data (No data sampling)
- Much easier to use
- Retroactively tracking
- Better Customer Support (Google Analytics support barely exists for the free plan.)
- Individual user data tracking
- Built-in Report Builder
- Email integration
2. Visitor Analytics
Visitor Analytics offers robust web analytics software whose quality rivals Google Analytics. If you are looking for a promising tool without compromising your data privacy, Visitor Analytics is 100% worth your serious consideration.
Key Features
Visitor Analytics functions as a straightforward analytics platform. You won’t see any flashy features that you will not use in your lifetime.
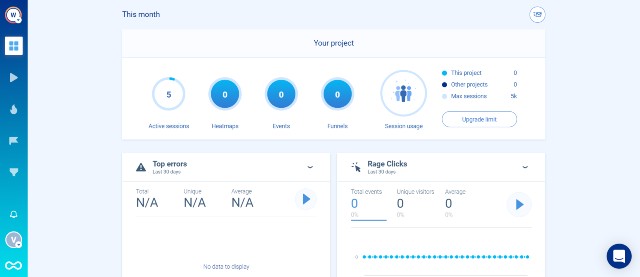
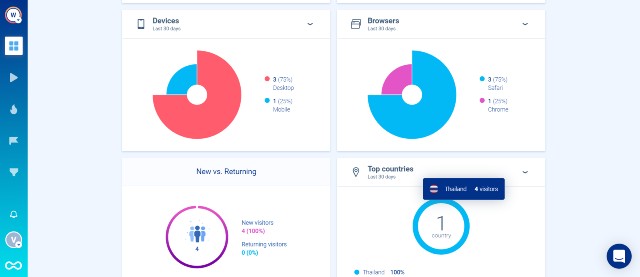
Website Statistics – This feature helps users discover more about their website performance. This will display significant metrics such as visitors, sessions, bounce rate, average session duration, and many more.
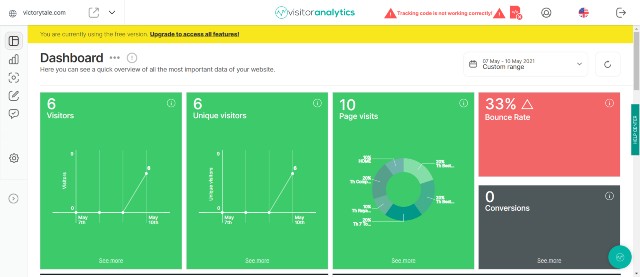
You can also discover your user behavior, acquisition method, campaign performance, and other metrics. This is more or less similar to what Google Analytics provides. However, Visitor Analytics presents this data in a more straightforward and user-friendly way.
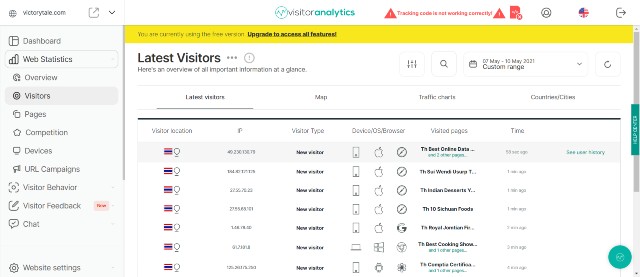
What I like most is the user interface. The dashboard loads fast is colorful in appearance, and, most importantly, you can find everything on the same page. The font size is also huge, making it ten times easier to read than Google Analytics.
Competition Analysis – Visitor Analytics will compare your website performance to that of the industry average to ensure that yours is not lagged.
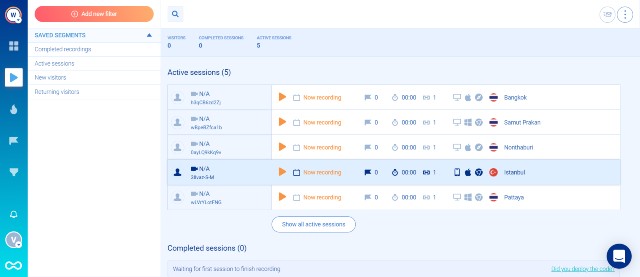
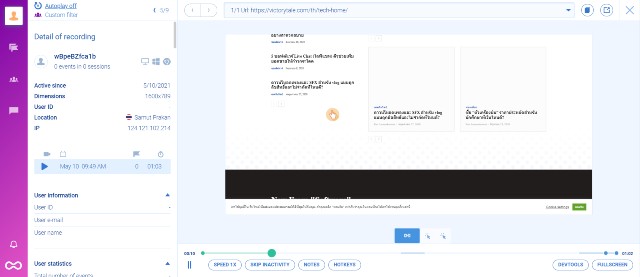
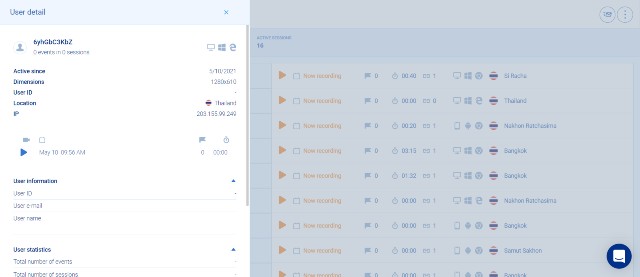
Visitor Recordings – This feature allows you to view real videos from your website’s visitor sessions. It will reveal how they react to your pages, including scrolling, mouse movement, or clicking.
I think this feature would be particularly beneficial if your website is struggling from low conversions despite having a large number of visits. You can use this insight to redesign your page to attract more action from your prospects.
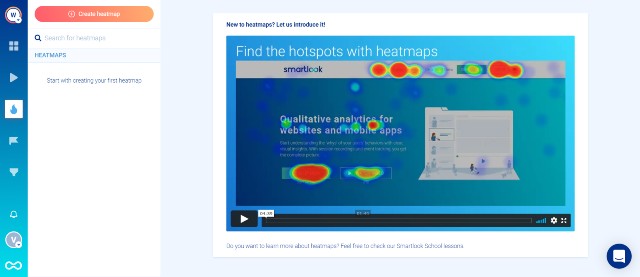
Heatmaps – You can create heatmaps of a specific page of your own choice to view real users’ interactions on them.
Using heatmaps alongside visitor recordings will help you create a more comprehensive picture of user interaction and allow you to find hidden issues.
Funnels – Visitor Analytics can create a beautiful funnel within minutes. You can use it to analyze where you lost most prospects and find ways to tackle those pain points.
The excellent guide below shows you how to create funnels in Visitor Analytics.
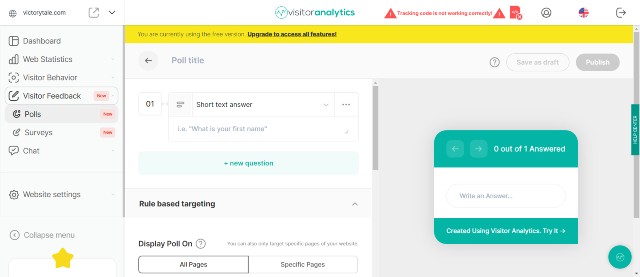
Visitor Feedback – Visitor Analytics is equipped with a built-in poll and survey builder that can integrate seamlessly with your website.
Although this builder may not have advanced features like specialized customer feedback software, the polls and surveys it generates are interactive and professional-looking, suitable for most websites.
Regarding privacy, Visitor Analytics utilizes cookieless tracking and does not engage in cross-site tracking at all. The tool also fully complies with GDPR and CCPA rules.
As a result, you can freely discard the consent banner from your site. You may also rest assured that data ownership is fully yours, and no third party will be able to take advantage of your data.
You can also anonymize each visitor’s IP address. This will ensure that Visitor Analytics will not collect that data while other data points are appropriately tracked and collected.
Currently, Visitor Analytics is in the process of releasing new features. I will update this section if new key features are available.
Pricing
As of May 2021, Visitor Analytics has five pricing plans as follows (all pricing below is for annual plans):
- Free
- Basic – $8.29 per month
- Advanced – $16.59 per month
- Pro – $33.19 per month
- Pro Plus – $58.09 per month
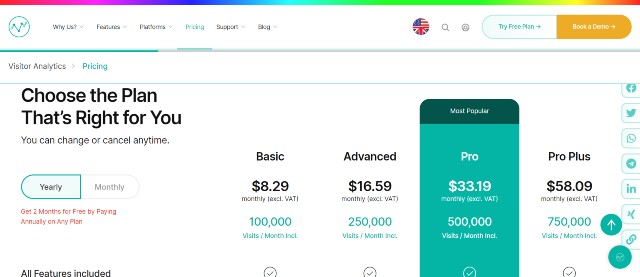
Each plan has access to all features (the free plan included.) The only difference is the quota of resources per month, including page views, heatmaps, recording sessions, and many tools.
For example, the free plan can track up to 1,000 visits and use only one heatmap, while the advanced plan can track as many as 250,000 visits and simultaneously utilize as many as 15 heatmaps.
Therefore, selecting the plan would be straightforward. You just need to use the one that matches your current monthly traffic.
My Evaluation
I have compared Visitor’s Analytics with many Google Analytics alternatives and found that their pricing is one of the most inexpensive.
Though their features are not the most powerful in the market, they are handy and provide excellent value for money.
Please don’t hesitate to sign up for a free account to test all the features if you are interested.
Visitor Analytics vs. Google Analytics
Google Analytics is better on:
- More in-depth metrics and data
- Mobile Apps
- Testing and other advanced features
Visitor Analytics is better on:
- Cleaner and faster dashboard
- Much better user interface and data visualization
- Much better customer support
- More details on individual visitors
- Easier-to-use heatmaps and funnels
- Visitor Recordings
- User Privacy Protection (GDPR/CCPA Compliant)
- Cookieless Tracking
- No need to place a consent banner on your site
3. Matomo
Matomo, or previously Piwik, is possibly the best-known Google Analytics alternative. It currently serves more than 1 million websites from 190 countries. Thus, you could be sure that its service is reliable and trustworthy.
Key Features
Web Analytics Platform – Matomo functions as an excellent web analytics tool. You can accumulate all customer data and analyze them to provide insights for your business.
I like its dashboard. It provides a summary of your website metrics within the selected timeframe. The dashboard is also fast, simple, and easy to understand.
You can find out about your user behavior, acquisition, sales, goals, real-time data, and other vital metrics within a single click on the left-side toolbar.
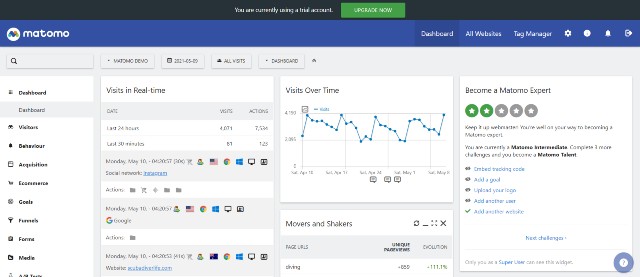
Furthermore, you can select each metric to compare the results over time. This is done in one click. I don’t need to create a separate report for it at all.
Some data points may not have as many in-depth details as Google Analytics, but it has everything site owners need. In addition, Matomo does not use data sampling. Hence, you will be able to access all your data thoroughly and precisely.
Still, I think the visualization should be more colorful and interactive. Currently, it is too bland and somewhat “boring” to read.
Visitor Log – This is one of my favorite Matomo features. Matomo will collect each visitor’s log and build an individual visitor profile.
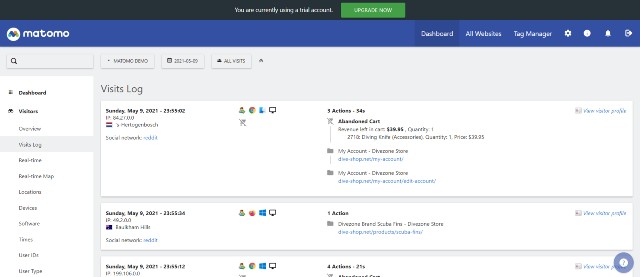
Hence, you will be able to view the entire customer journey of a particular visitor and other significant details, such as acquisition method, behavior, and location.
This data is particularly beneficial in evaluating the performance of your marketing tools, such as landing pages, and finding a solution for annoying problems such as high cart abandonment rates.
Enhanced SEO – This feature provides advanced user-based insights for SEO. It will show crawling statistics, keyword ranking positions, campaign tracking, and many more.
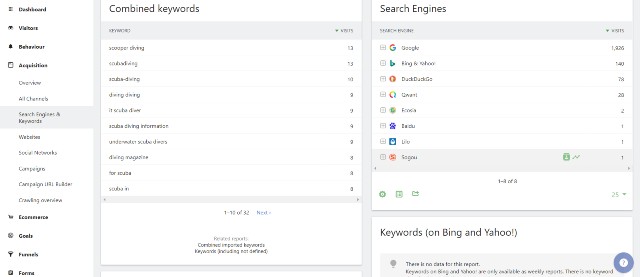
Best of all, Matomo will explicitly show the keywords on search engines that have directed visitors to your website (if available.)
This helps provide insights on keyword research, as many keywords appearing may be undetected by keyword research tools. As a result, you can discover hidden ones and optimize your content for improved SEO performance.
A/B Testing – You can use Matomo to conduct A/B Testing to find the settings or landing pages that perform best on the selected metrics.
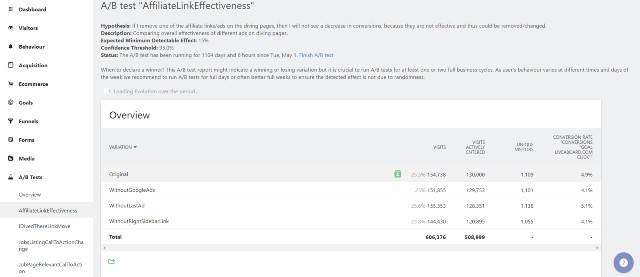
The test will integrate automatically with the Visitor Log/Profile, so you will always know what settings the visitor has gone through.
Heatmaps – Like Hotjar and other heatmap software, Matomo provides insights on how visitors engage with a particular page or post on your website.
For example, it will visually display the buttons and links that visitors pay attention to, click on, or ignore. This way, you can discover and fix hidden issues that may significantly decrease your conversion rates.
Session Recordings – This feature has the same goal as heat maps. It will help you understand how visitors interact with a particular page or post.
Using this feature is straightforward. You can record sessions on a particular page or post and view that playback later. The playback will show you how users click, scroll, and interact with elements on the site.
In my opinion, this feature enhances heatmaps well and helps you uncover the most hidden insights.
Tag Manager – Matomo’s Tag Manager helps your developers control all third-party cookies without backend access.
No Consent Screens – Upon using Matomo, you can utilize cookieless tracking. Thus, you do not need to show a large consent banner that will degrade your website performance and irritate all visitors. You can read more on why you don’t need the banner from this link.
Open Source – All of Matomo’s source codes are open-source. You can access them all on the Github platform.
Pricing
As of April 2021, Matomo has two plans for users to consider:
- On-Premise (Free)
- Cloud (starting at 29 EUR per month)
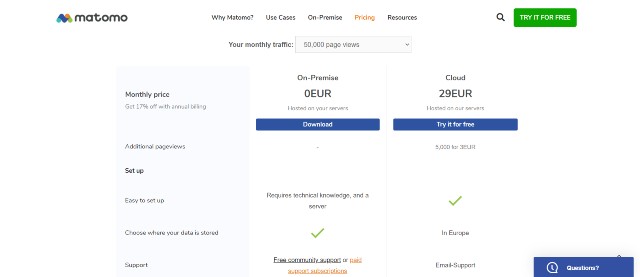
The On-Premise plan is equipped with basic analytics features. You will have to host Matomo on your server. There is no limit to page views, team members, and websites.
However, you will not get advanced features that make Matomo shine, including Heatmap and A/B Testing. You need to pay a yearly fee for add-ons (199 EUR per year) or subscribe to the Cloud plan to access them.
Alternatively, the Cloud plan hosts Matomo on Matomo’s server in Europe, thus completely removing the load on your server. You will also get all the features without paying extra.
Still, the Cloud plan will limit page views, websites, segments, and goals for each plan. So your subscription fees will indeed depend on the monthly page views you need.
For example, 50,000 page views costs 29 EUR, while 1,000,000 page views costs 239 EUR. If your traffic exceeds the monthly limit, you will have to pay 3 EUR per 5,000 page views.
If your website is relatively new, content-based, and has a few visitors per month, I suggest sticking with the On-Premise (free) plan.
Though paid features may be helpful, they are far from necessary for new websites and blogs. You already have a powerful analytics tool to help you gain essential insights. Therefore, you would better spend your budget elsewhere.
Nevertheless, if you own a growing eCommerce website, I suggest selecting the Cloud plan. This will help you access all advanced web analytics features and save your server resources for traffic spikes.
Still, suppose your eCommerce or business website contains highly sensitive data, or you are highly concerned about privacy. Then, it may be better to host Matomo on your own server (select the On-Premise plan) to ensure 100% data ownership.
My Evaluation
Matomo is a promising open-source Google Analytics Alternative, prioritizing transparency and data privacy.
The features are varied and powerful. The data displayed is accurate with no data sampling. The only thing I don’t like about Matomo is its subpar data visualization.
I think their developers should add more charts and colors to the platform, as right now, it looks very “boring.”
You can try Matomo Cloud for free for 21 days (no credit card required)
Matomo vs. Google Analytics
Google Analytics is better on:
- Better data visualization
- In-depth data points
- No hidden fees or paid features
Matomo is better on:
- Simpler Analytics Platform
- Much Faster Dashboard
- Easier to use effectively
- No-code installations in most cases (Plugins are available for WordPress users)
- Cover Individual user visit data over the entire user journey
- More Accurate data (no data sampling)
- Cookieless tracking, thus no need for consent banners
- Open Source Analytics Tool
- Form Analytics
- Comply with all privacy laws
- Better Support (for Cloud plan users)
4. Smartlook
Smartlook is one of the best Google Analytics alternatives for many businesses. The software receives excellent scores across various review platforms.
Besides regular web analytics, the platform features advanced screen recordings, which allow developers to find bad UX design before it cripples your conversion rate.
So if you are searching for the right analytics tool that will not break the bank, you cannot just ignore Smartlook.
Key Features
Smartlook has two core analytics services. The first is website analytics. The other is mobile app analytics. I will focus only on website analytics for now.
Analytics & Reporting – Smartlook provides an excellent dashboard and real-time analytics platform that allows you to track your website’s most important metrics.
Apart from the regular metrics you are familiar with (such as Bounce Rate), Smartlook can track unique metrics that provide insights into your website design, including
- Rage Clicks (Smartlook records events where user rage clicks on your site, which could be an indication of bad UX Design.)
- JavaScript Errors – (Smartloo collects information about JavaScript errors that appear in your console.)
The dashboard is interactive and fast. In addition, Smartlook utilizes charts and other data visualization methods, making the data more accessible and easier to interpret than Google Analytics.
Recordings – This is unarguably the flagship feature for Smartlook. The platform will record every action of a user. Thus, you can go back anytime to view a recorded video of any visitor session.
This feature is beneficial for your team to understand customer behavior. For instance, you can view any session with rage clicks and errors on your site or a bug that may ruin your customer journey.
Therefore, your developers will understand the issue immediately and swiftly fix it before it causes a bad reputation.
Furthermore, your customer support team can use it to provide better service. Agents can view each customer’s session to visually grasp the problem, which is much faster and easier than reading text explanations provided in the support ticket.
Visitor Journey – Smartlook will keep track of each individual user’s journey. You will always know what they did during those sessions.
You can also use the Smartlook API to identify users who have signed up or subscribed by name or email. Hence, your team can engage with them faster if they need assistance.
Event Tracking – You can view any event that occurs on your site with a few clicks. As Smartlook utilizes retroactive tracking, you can analyze all the statistics and videos associated with it since you add Smartlook to your website (including the time before you create an event.)
There are several pre-built, ready-for-use events. You can also use the Smartlook API to send any custom events to the platform.
Retention Tables – A specialized table designed exclusively for customer retention purposes. You can find detailed information on user engagement and users who need extra assistance from your team. Creating a table is as easy as one click.
Funnels – You can create an excellent funnel from both events and URLs. The funnel also utilizes retroactive tracking. Thus, you can view the data back to the time you installed Smartlook on your site.
Heatmaps – Similar to other web analytics tools, Smartlook can create a heatmap to view user behavior on a specific page. In addition, you can segment all users into groups, such as devices or status of visitors (new or returning), to better understand each group’s behavior.
Pricing
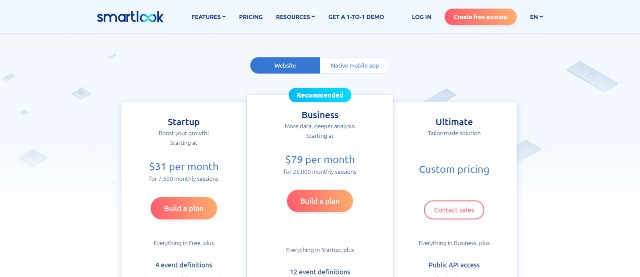
Smartlook offers two pricing plans for website analytics users.
- Startup – starting at $31 per month for 7,500 sessions
- Business – starting at $79 per month for 25,000 sessions
Regarding the features, both plans have all the features, but the Business plan will have more event definitions, can merge events, and have access to live chat support.
However, the monthly fee will increase proportionately with these two factors below.
- Monthly Session Limit
- Data History
There is also a universal limit to monthly session quotas for both plans. The Startup plan can receive up to 100,000 sessions, while the number is 250,000 for the Business plan.
If your website traffic exceeds 250,000 sessions, you will need to contact Smartlook to create a customized plan.
Furthermore, the Startup plan cannot have a data history longer than one month. On the other hand, the Business plan can store data for 12 months. The longer the data history, the more expensive the fee is.
Take this as an example; suppose you choose a Business plan with a monthly session limit of 100,000 and a data history of 6 months. Your monthly fee is $256.
In addition, many may wonder how much data history you need. I think the answer is subjective.
Most website owners, including myself, are familiar with Google Analytics’ 26-month data retention. However, according to Smartlook, many companies retain it much shorter.
Personally, I want to keep it at least 3-6 months or even a year to compare QoQ and YoY results. I think this usage is also applicable to many businesses. Thus, we will need to subscribe to the Business plan.
However, if that condition is not relevant to you, please choose the Startup plan and enjoy paying lower fees per month.
My Evaluation
Overall, I believe Smartlook is one of the best Google Analytics alternatives available. The tool has a particularly robust recording feature that allows website owners to track every user session and event on your site.
If you are interested, why don’t you try it for free? You can track up to 1,500 sessions per month without paying a dime.
Smartlook vs. Google Analytics
Google Analytics is better on:
- More in-depth data and features
- A much longer data retention period (26 months vs. 1-12 months for Smartlook)
Smartlook is better on:
- Much more user-friendly interface and data visualization
- No steep learning curve (Beginner-friendly)
- Powerful recordings to automate customer engagement tracking
- Individual Customer Journey Analytics
- Retroactive Analytics
- GDPR/CCPA Compliant
- Easier installations (WordPress plugin is available + Google Tag Manager Implementation)
- Much more responsive support (Live Chat)
- No data sampling (unless you request it.)
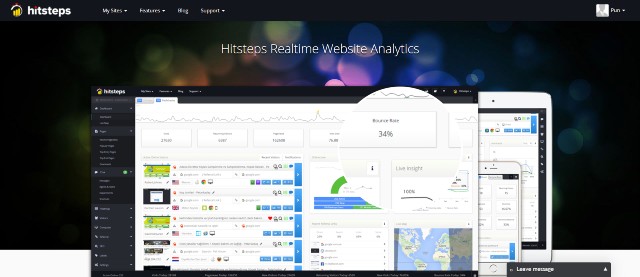
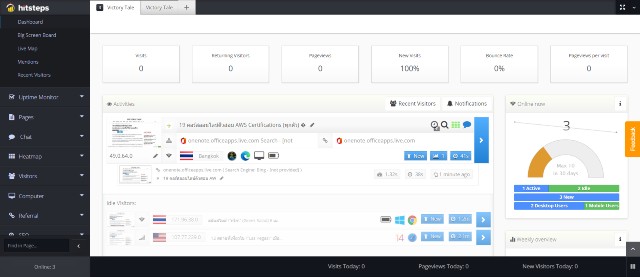
5. HitSteps
HitSteps is another Google Analytics alternative that features fast and accurate real-time analytics, live chat, and uptime monitoring.
If you are looking for a reliable multifunctional tool for your website’s marketing campaign, HitSteps should definitely be on the radar.
Key Features
Live Dashboard – This feature from HitSteps allows its users to track real-time statistics. You will know how many visitors are on your site, their geolocation, and many other valuable data.
Advanced Web Analytics – Hitsteps provides highly detailed information regarding your website visitors. In addition to regular website metrics, the platform can reveal insights about visitors who use the company’s internet, Adblock software, or even the Tor Browser.
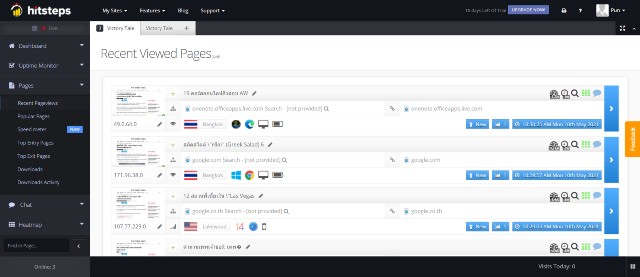
Keyword Analytics – Like Matomo, HitSteps will display the keywords that each visitor uses on search engines to reach your site. Feel free to ask your SEO content writers to optimize them and generate additional organic traffic.
Smart Uptime Reporting – You don’t need to worry about failing to notice when your website goes down since HitSteps will track your website every minute from many countries to ensure no downtime.
However, if your website has one, HitSteps can notify you by email, SMS, or even a call.
Page Analysis – This feature tracks HTML elements of any specific page, including popups, banners, submenus, and many more.
Thus, you will receive valuable in-depth insight into the performance of each element you put on the page. This would help you solve UI/UX issues and boost the conversion rate.
Heatmap – Heatmaps from HitSteps function similarly to those from other analytics tools. It assists you in learning user behavior and making evidence-based changes to your site.
Cross-Device Tracking – HitSteps can track all users across multiple devices. Hence, users can be confident that their data is accurate and unimpacted by a visitor’s various accesses to the website from different devices.
Live Chat – Live Chat is a supplement tool for HitSteps users to provide direct and timely assistance to customers. Though it lacks the advanced features of full-fledged live chat software, it is fast, lightweight, and equipped with a message sneak-peek feature.
Profile Visualization – Once users submit their information via forms, HitSteps can automatically alias their identity to individual profiles. Thus, it is much more comfortable for you and your team to keep track of them.
Pricing
Currently, HitSteps has five pricing plans as follows:
- Free
- Starter – $4.99 per month for 10,000 pageviews
- Basic – $9.99 per month for 50,000 pageviews
- Pro – $21.99 per month for 500,000 pageviews
- Business – $49.99 per month for 1,000,000 pageviews
All pricing is for monthly plans. Those who subscribe to annual plans will receive a 10% discount.
The difference in each plan lies in features and allocated resources (page views, number of websites, data history, etc.)
I recommend subscribing only to the Basic plan and above. This is because the first two plans lack essential features, including campaign and goal tracking and heatmaps.
The Basic Plan will have all the above features that the first two plans lack. However, its users still do not have access to uptime monitoring. I don’t think this feature is necessary if your hosting is performing this task or if you already have other tools such as Jetpack.
My Evaluation
From an overall perspective, HitSteps is an affordable Google Analytics alternative. Though it does not have flashy features such as screen recording, it functions well as analytics software.
HitSteps’s pricing is also inexpensive and provides excellent value for money for small websites. However, enterprise-level companies may want to look elsewhere, as other excellent Google Analytics alternatives have more comprehensive features.
HitSteps vs. Google Analytics
Google Analytics is better on:
- More features and in-depth metrics
- Much longer data history (26 months vs. 1-12 months for HitSteps)
- Much More Stable Platform
- Mobile Apps
HitSteps are better on:
- More Detailed Real-Time Analytics
- Organized and Uncluttered UI
- Easier-to-use and Faster
- Uptime Monitoring
- Profile Visualization
- Better Customer Support
- Adblock, Tor Browser Detection
- GDPR – Compliant
- Built-in Live Chat
- The White Label service is available for marketing teams.
6. GoSquared
GoSquared is a company that offers various types of software solutions, including web analytics, marketing automation, a customer data hub, and live chat.
With numerous features, its usage potential is far beyond just web analytics. Using GoSquared can reduce the subscription fees you need to spend per month.
Web Analytics Tool Features
Since GoSquared’s suite has numerous features, it would be off-topic to include them all in this section. Hence, I decided to focus only on its web analytics tool and relevant features.
Now Dashboard – This feature is essentially a real-time analytics tool that collects and displays the most significant data points from your website in real-time.
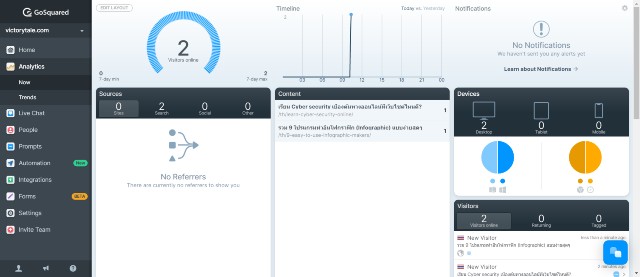
I personally appreciate the dashboard. In addition to being fast and beautifully visualized, it provides excellent insights on one page. You don’t need to search for the necessary data and metrics similar to what you have done with Google Analytics.
Alerts – GoSquared will send alerts via email, Slack, or other communication platforms if website traffic spikes or plummets.
Trends Dashboard – This feature focuses on providing trends and predictive analytics. The platform will automatically compare your current timeframe data with the previous timeframe. Hence, you can quickly grasp the current situation of your website.
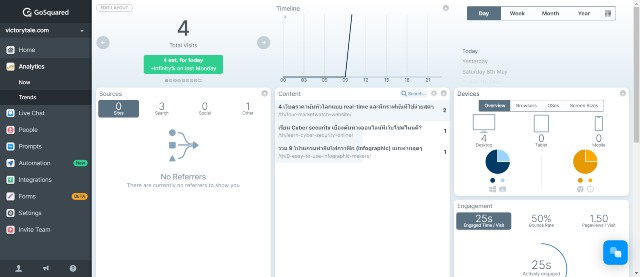
Furthermore, as GoSquared will gather your data over time, it will predict your future web traffic based on your historical data.
Customer Data Hub – GoSquared can collect information about individual users and create a profile for each. Hence, it is effortless for marketing teams to utilize this contact in marketing automation campaigns.
Smart Pinging – Unlike other tools, GoSquared utilizes smart pinging technology, which allows the platform to accurately measure data, especially the bounce rate, average session time, and many others.
You can read more on this technology in this article from GoSquared
Pricing
There are two ways to subscribe to GoSquared as follows:
The first method is to subscribe to the web analytics platform alone. The pricing will increase proportionately with pageviews. It starts at $29 per month for 100,000 pageviews.
The second method is to subscribe to the Suite, which includes all the features available on GoSquared. It starts at $79 for 200,000 page views. You will need to pay more if you need more page views.
It is worth noting that you need to subscribe to the Suite plan to access the Customer Data Hub.
I think plan selection should depend on your needs. For example, if you only need a Google Analytics alternative without other marketing features, it would be best to subscribe to the analytics platform alone.
My Evaluation
From a holistic perspective, the platform lacks several web analytics features that other web analytics tools provide, such as heatmaps and screen recordings.
GoSquared does offer other marketing features, but they still could not compare with specialized tools. If you already have such tools, the benefits of GoSquared will be much lower.
Thus, regarding pricing, Visitor Analytics and Matomo provide more value for money. Still, this should not discourage you from using GoSquared.
As a Google Analytics alternative, GoSquared performs very well. The platform is clean and straightforward to use. The data is also more accurate and reliable than tools that use unreliable session-based analytics.
Although GoSquared is devoid of game-changing features that make other tools shine, it is still 100% worth your consideration.
You can try GoSquared for free (1,000 monthly pageviews.)
GoSquared vs. Google Analytics
Google Analytics is better on:
- More features and metrics
- Mobile Apps
GoSquared is better on:
- Much better user interface
- More beautifully visualized data
- Much Faster
- Perfectly Responsive
- GDPR – Compliant
- More Accurate Data (No Data Sampling + Smart Pinging Technology)
- Trends and Predictive Analytics
- Individual user analytics
- Much better customer support
Unlike Matomo, GoSquared is not an open-source analytics platform. However, the developers have released the source code of some projects here.
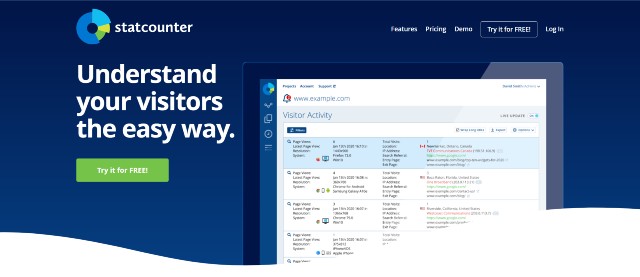
7. StatCounter
If you have a limited budget but don’t want to use Google Analytics on your site anymore, I suggest you try StatCounter. This tool provides powerful features at a reasonable price.
Key Features
StatCounter is a straightforward tool. Most of its features focus on web analytics. Therefore, you won’t see flashy features as you did with other Google Analytics alternatives in this list.
Summary Stats – StatCounter tracks users and summarizes your website’s essential metrics. The dashboard is uncluttered and fast, making it effortless to access the data.
Paid Traffic Report – StatCounter will monitor all traffic your website receives from your digital advertising campaigns (Facebook, Twitter, Google Ads.)
The tool will automatically detect click farms and report them. You can then download the spreadsheet data and submit it to Google to get a refund.
Visitor Alerts – StatCounter ensures that you will not miss any significant visitors by sending a notification anytime they visit your website.
Keyword Data – You can sync keyword data with StatCounter and unlock hidden search terms visitors use to reach your site.
Recent Activity Feeds – This feature tracks each user and collects their user behavior on your site. This will help identify your leads from a sea of anonymous visitors.
Mobile App – StatCounter has its own app for iOS and Android users. Hence, you can view your data anywhere, anytime.
Pricing
StatCounter only has a single straightforward pricing plan. The pricing starts at $9 for 100,000 pageviews and increases proportionately with the pageview limit.
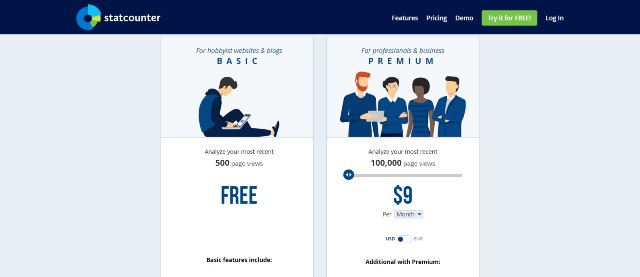
The monthly fees will be even lower if you subscribe to the annual plan. It will cost only $7.4 for 100,000 pageviews. There are very few web analytics tools that offer such inexpensive rates.
My Evaluation
StatCounter is possibly one of the cheapest options available. The platform also offers accurate, actionable insights without the steep learning curve.
Thus, the tool is highly suitable for small website owners with minimal budgets and no marketing team.
However, its features are indeed fewer than that of most web analytics software. Many other tools offer more comprehensive web and behavioral analytics. Therefore, it would be best for eCommerce websites and larger businesses to look for alternatives elsewhere.
StatCounter vs. Google Analytics
Google Analytics is better on:
- More features and more in-depth metrics
StatCounter is better on:
- Click Fraud Detection
- More accurate results (no fraud or bots)
- Individual Visitor Journey Analytics
- Easier-to-use
- Much Better Support
- Better Visualized data
- Alerts
Other Best Google Analytics Alternatives?
Below are some of the other best Google Analytics alternatives you may want to consider. I did not include them in the list as they are out of reach for small businesses. Nevertheless, medium-sized or large enterprises could find them worth considering.
Piwik Pro Analytics Suite – Piwik Pro Analytics Suite is a well-rounded platform that assists companies in tracking the entire customer journey on their apps and websites.
You can also choose to host the platform on different types of hosting, including in the Private Cloud.
Woopra – Another customer journey analytics platform that works flawlessly as one of the best Google Analytics alternatives.
Woopra offers much deeper analytics than most other tools, thus excellent for companies with a full-time data analyst or business intelligence analyst in the team.
The pricing for Woopra starts at $349 per month, but to use it at its full potential, you need to pay $999 monthly.
Adobe Analytics – Another excellent Google Analytics alternative for enterprises. Adobe Analytics provides in-depth web analytics, marketing analytics, and predictive analytics.