Data analytics has become an essential element for many of the fastest-growing sectors such as information technology, marketing, banking, and many other industries.
Undoubtedly, having data analytics skills will help you get a lucrative career in today’s economy. According to Glassdoor, an average data analyst in the US earns $72000 per year. This can increase many times once they assume senior roles at their companies.
Furthermore, data analytics is the foundational knowledge for advanced subjects that can be extremely valuable and lucrative if you master them. These include machine learning, deep learning, computer vision, and many more. Specialists in these fields can earn as much as $150000 per year.
You can learn and master data analytics anywhere, anytime, through online courses. However, finding reliable courses can be time-consuming and tedious.
Hence, I decided to do the heavy lifting for you. This article will outline below the best data analytics courses. You can then pick the one that suits your preferences most and start learning right away.
Affiliate Disclosure: This article from Victory Tale contains affiliate links. We will receive a small commission from our partners if you purchase their courses.
Nonetheless, we always value integrity and prioritize our audience’s interests. You can then rest assured that we will present each course truthfully.
Things You Should Know
Prerequisites
Featured in this post are both beginner-level and advanced courses. The former has no prerequisites. Everyone can start taking the course right away.
On the contrary, some courses are not for absolute beginners. You should have robust knowledge in the following:
If you are interested in such courses, please ensure that you fulfill all of these prerequisites before enrolling in courses featured in this list.
Note: I will explicitly state all the extra prerequisites for advanced courses when discussing them below.
Criteria
Below are the criteria for the best data analytics courses.
Best Data Analytics Courses for Beginners
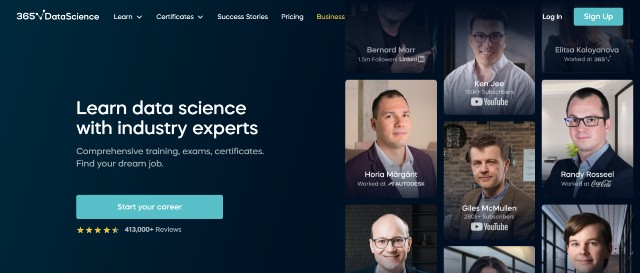
1. 365 Data Science
If you want to learn data science (or specifically, data analytics) through video lessons, 365 Data Science is probably the best option available.
You will learn from a team of veteran instructors who have significant industry experience working at leading companies such as Google, Autodesk, and many others.
Data Analyst Career Track
This career track is designed for students who want to become data analysts. It consists of 10 courses as follows:
- Introduction to Data and Data Science
- Introduction to Excel
- Statistics
- SQL
- Introduction to Python
- The Complete Data Visualization Course with Python, R, Tableau, and Excel
- Data Preprocessing with NumPy
- Data Cleaning and Preprocessing with Pandas
- SQL for Data Science Interviews
- Dates and Times in Python
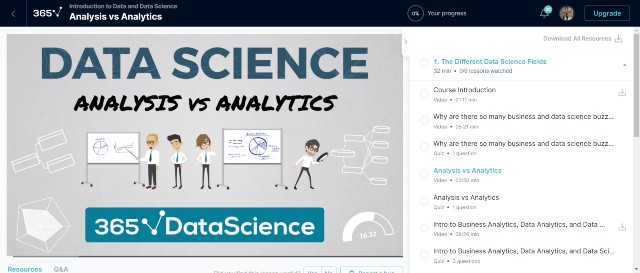
This curriculum has more than 41 hours of video content, covering all aspects of data analytics from the very beginning in the most logical order. Furthermore, all videos are also bite-sized. Hence, absolute beginners can proceed through the career track without hassles.
Each course has quizzes and coding assignments that you can practice your skills. The only drawback is that there are no large-scale, challenging projects for students to complete. You may need to subscribe to ProjectPro (see below) to gain more hands-on experience.
Once you complete this career track, you can also take 365 Data Science’s machine learning and deep learning courses (already included in the subscription) to further expand your knowledge, which will allow you to conduct more in-depth data analysis.
Pricing
365 Data Science offers three paid plans as follows:
- Premium Monthly – $36 per month
- Premium Annual – $29 per month (billed annually)
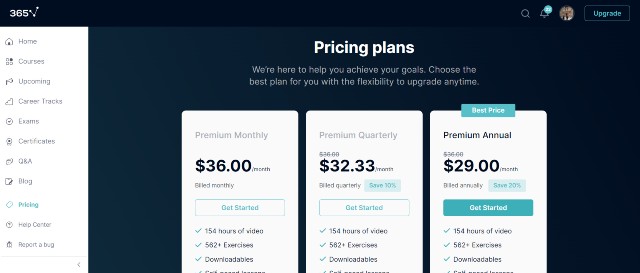
All plans are essentially the same. They provide full access to all video content (253 hours in total) and assignments (672, as of 2024) on the platform. The only difference is that the annual plan also provides access to resume and portfolio review services.
The platform has sufficient content for most students to learn from for more than a year. Hence, subscribing to the annual plan would prove the right decision.
However, if you are a fast learner, I don’t think you will need an annual plan since you may complete all courses in a few months. Just subscribe to the monthly plan to save your budget.
If you are still unsure whether 365 Data Science is the right choice for you, I suggest creating a free account to take the free lessons on the platform.
Pros & Cons
Pros
- Learn from veteran industry experts
- Beginner-friendly, easy-to-follow curriculum
- Bite-sized video lessons
- Self-paced learning
- 30-day money-back guarantee
- All-inclusive pricing (Provide complete access to all video lessons + No hidden fees)
Cons
- No large-scale projects for students to complete
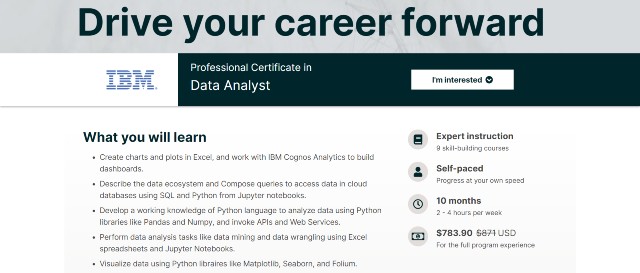
2. IBM Data Analyst
This data analyst program provides fundamental data analytics training for absolute beginners. You will learn from a team of eight experts. All of which are veteran data scientists at IBM.
Course Content
The program has eight following minor courses: To earn a digital certificate and badge, you will need to complete them all.
1. Data Analytics Basics for Everyone – The first course will discuss data analytics fundamentals. You will learn the nature of each essential step, along with valuable tools, tips, and techniques, in detail.
Also, you will grasp how each data role is different (e.g., data scientist vs. data analyst vs. data engineer) and explore various lucrative career opportunities in the field of data science.
2. Analyzing Data with Excel – The second course will go over Excel spreadsheet features and explain how you can use them to perform basic data analysis. For example, you will use functions to clean the data and use pivot tables to analyze them.
3. Data Visualization and Building Dashboards with Excel and Cognos – In this course, you will learn how to use Excel and IBM Cognos to create dashboards filled with visualizations to create a compelling data story.
4. Python Basics for Data Science – The fourth course is essentially a Python for Data Science course. You will learn fundamental Python programming up to what is required for data science. Later, you will learn how to use the Pandas library to perform data analysis in Python.
5. Python for Data Science Project – The fifth course serves as a mini project for learners to apply what they have learned to real-life scenarios and gather some hands-on experience.
You will use Python to create a web scraping tool, analyze stock market performance, and build a dashboard to convey actionable insights to your audience.
6. SQL for Data Science – The sixth course will delve into SQL (Standard Query Language). You will learn how to use it to store, communicate, and extract various data types from relational databases.
Specifically, you will create a database instance in the cloud, build and run SQL queries, and access databases from Jupyter Notebooks.
7. Analyzing Data with Python – This course will teach you how to use all vital Python libraries to perform data analysis.
In other words, you will create multi-dimensional arrays with NumPy, analyze data with Pandas, manage scientific datasets with SciPy, and build machine learning models with Scikit Learn.
8. Visualizing Data with Python – The eighth course will introduce you to three popular Python data visualization libraries: Matplotlib, Seaborn, and Folium. You will use different visualization tools, simple and advanced ones alike, to interactively bring forth insights to the audience in an approachable manner.
9. Capstone Project – The final project will provide you with opportunities to use all the knowledge you have learned in a simulated environment.
You will assume the role of a data analyst of a hypothetical company and perform all the data analytics tasks, starting with data collection, data wrangling, data manipulation, exploratory data analysis, and ending with data visualization.
Regarding pace, IBM suggests only 2-4 hours of weekly commitment for ten months, which is manageable for students with full-time employment. However, diligent students can also complete the coursework much faster, as the program is self-paced.
Important Note: This program is available for auditing (free) and enrolling on both Coursera and edX. However, the full program on Coursera is significantly cheaper. It only costs $429 on Coursera if you finish the coursework at the suggested pace, compared to $783.90 on edX.
Pros & Cons
Pros
- Learn from the team of experts at IBM
- Comprehensive curriculum
- Self-paced learning
- Bite-sized, beginner-friendly video lessons
- Offer various case studies and hands-on labs for learners to apply concepts through real-life examples
- Free auditing
Cons
- Based on actual student reviews, the Python project (Course 5) can be too challenging for absolute beginners who don’t have prior programming experience.
- Some courses have minor quality issues that students may find distracting.
- Not the best course if you prefer not to use IBM tools such as Cognos or Watson
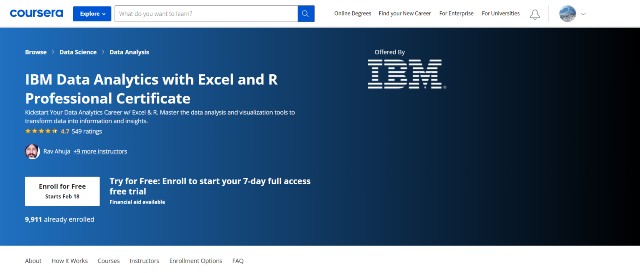
3. Data Analytics and Visualization with Excel and R
This program from IBM will guide you through the entire process of data analysis and data visualization. Instead of Python, you will use Excel and R to generate actionable insights and create an engaging story to convey the results to your audience.
Course Content
This program comprises eight minor courses (Course 1-3 are the same as those on the Python curriculum. Hence, I will start with Course 4.)
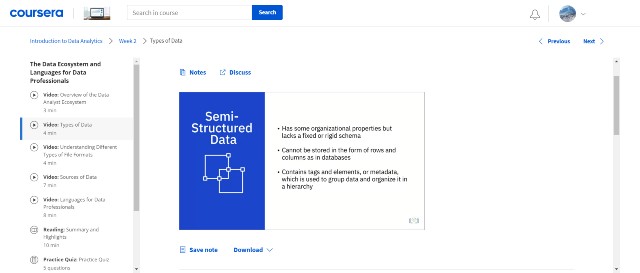
4. R Programming Basics for Data Science – The fourth course will explain the fundamentals of the R programming language. You will learn about data types, data structures, control flows, functions, and how to use R to manipulate data and scrape websites.
5. SQL for Data Science with R – The fifth course will delve into SQL and relational database concepts. You will write basic SQL statements and use them to manage databases.
Subsequently, you will use both R and SQL to query real-world datasets.
6. Analyzing Data with R – This course will walk you through data analysis fundamentals and all of its processes.
You will learn how to use R to prepare your data, improve your understanding of your data through exploratory data analysis, and create and evaluate R models to identify key relationships between different variables.
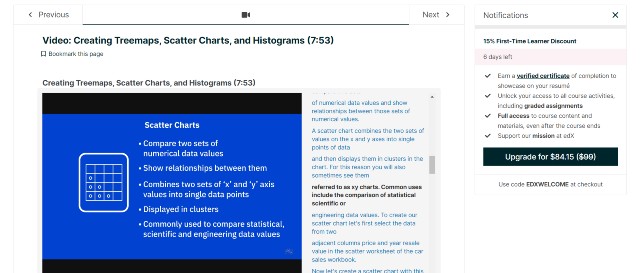
7. Visualizing Data with R – The seventh course will drill deep into the ggplot2 package, which allows users to create compelling visualizations with R.
You will create bar charts, histograms, scatterplots, box plots, and many more. Subsequently, you will learn how to customize them using themes.
The second part of the course will explain the steps to create map plots and interactive dashboards using Leaflet and R Shiny packages. You will then add HTML components to deploy your data apps on the web.
8. Capstone Project – In this project, you will assume the role of an entry-level data scientist of a hypothetical organization. The goal is to create a readable report and a summary that convey actionable insights to the organization’s shareholders.
Therefore, you will be responsible for performing all the data analytics tasks on real-world datasets. Completing them will provide you with immense practical hands-on experience.
The suggested pace for this program is similar to Python’s, or 2-3 hours per week for ten months. However, based on my observations, you can complete it much faster.
Note: You can enroll in this program either on edX or Coursera. Both will feature the same content and allow free auditing.
However, if you want a full program experience, you should select Coursera because it charges only $39 per month (or $429 if you complete the program at the suggested pace) compared to edX’s $712 one-time.
Pros & Cons
Pros
- Learn from the team of data scientists and software engineers at IBM
- Well-structured curriculum
- Most lessons are informative and easy to follow.
- Project-based learning
- Free auditing
Cons
- In some lessons, the instructors assume that the learners are already familiar with the basic programming concepts. Unfortunately, many beginners do not. Thus many of them become confused.
- Not the best choice if you do not want to use IBM tools such as Cognos
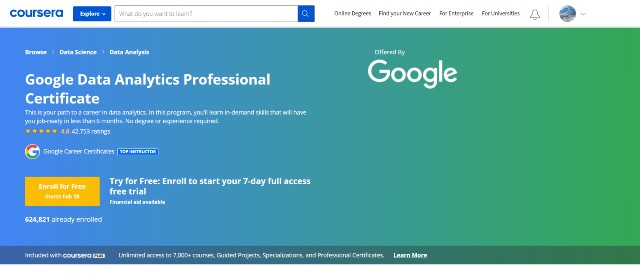
4. Google Data Analytics Professional Certificate
This Coursera program from Google Career Certificates will equip you with in-demand skills for a data analytics career. You will learn the concepts and applications and become job-ready in several months.
Course Content
This program consists of eight minor courses as follows:
1. Foundations: Data, Data Everywhere – The first course will introduce you to a data analyst role. You will learn about the day-to-day responsibilities skills required for this career.
Later, you will discover terms and concepts relevant to data analytics processes.
2. Ask Questions to Make Data-Driven Decisions – The second course will be all about questioning. You will learn the tips of effective questioning that will help data analysts understand problems better and develop solutions quicker.
3. Prepare Data for Exploration – The third course will kickstart your journey in data analysis. You will use Excel and SQL to extract, filter, organize and secure the data so that they are ready for further exploration.
4. Process Data from Dirty to Clean – In this course, you will learn the entire process of cleaning your data using spreadsheets and SQL, starting from developing SQL queries to verifying the results.
5. Analyze Data to Answer Questions – The fifth course will guide you on methods to analyze the cleaned data to gain actionable business insights through the use of formulas and functions in spreadsheets and SQL queries.
6. Share Data Through the Art of Visualization – The sixth course will help you get started with data visualization. You will use Tableau, popular data visualization software, to create dashboards, presentations, and visualizations to bring your complex data to life and convey insights to your audience.
7. Data Analysis with R Programming – The seventh course will introduce you to the R programming language. You will learn basic syntaxes and perceive how to use R to analyze data and generate visualizations.
8. Capstone – The final course is essentially a large-scale project where you will use all the knowledge you have learned from the previous courses. You will choose a real-world scenario and conduct an end-to-end data analysis on its data.
According to Google, you should spend 10 hours per week on the program, and you will complete it in six months. However, you can complete it much faster since it is a self-paced program.
Auditing all minor courses is free. Alternatively, you can opt for a full program experience, which costs only $14 per month.
Pros & Cons
Pros
- Learn from experts at Google
- Beginner-friendly curriculum
- Clear explanations of all concepts
- Informative, easy-to-follow weekly readings
- Free to audit + The full program is affordable.
Cons
- Do not include intermediate and advanced data analytics concepts
- The assignments are few and not very challenging.
- The video transcripts are not organized, thus extremely difficult to read.
Coursera Plus
This article features two Coursera programs. Some readers may not be able to decide which data analytics course to enroll in. My solution is simple. Take both by subscribing to Coursera Plus.
This subscription costs $399 per year (or $33.25 per month). It will grant complete access to most courses and programs on the platform (3000+ in total).
Hence, instead of paying $53 (39+14) per month for both programs, you will pay only $33.25, plus you can take many other courses as well. Coursera Plus undoubtedly provides value for money, thus the best choice for diligent learners.
[sc name=”coursera” ][/sc]5. Datacamp
Datacamp is an excellent way to learn data analysis if you are not a fan of the traditional learning approach. This platform will replace video lessons and readings with interactive lessons, which offer a far more engaging learning experience.
Course Content
Datacamp offers three full-fledged career tracks for data analytics as follows:
- Data Analyst (Python) – 66 hours from 17 courses
- Data Analyst (R) – 77 hours from 19 courses
- Data Analyst (SQL) – 41 hours from 10 courses
Note: Based on my experience, the course duration (in “hours”) above tends to be far higher than the actual hours you commit for each. For example, I usually spend only 1-2 hours completing a 4-hour Datacamp course.
The first two career tracks will essentially walk you through the entire data analytics process. They differ only in the programming language (Python or R). However, the one with SQL will go over database design and equip you with the skills to write proper SQL queries.
Optimally, you should complete all three. However, if you have limited time, you can choose between the Python or R career track and take it along with the SQL track. Subsequently, you can start working on projects that allow you to practice skills acquired from various courses.
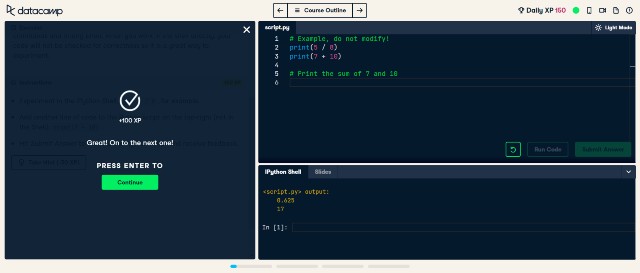
Below is what you should expect from the Datacamp lesson. All instructions and assignments are provided on the left side. You will read them thoroughly and type the code on the right (without the need to install the IDE).
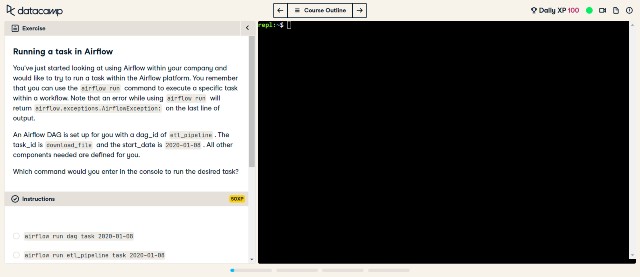
Once your code is ready, you can run it right away. If your answer is correct, you will be able to proceed to the next lesson.
On the other hand, in case you get stuck, no problem! You can request a hint or even a detailed solution.
Generally speaking, I am fond of Datacamp’s approach. To me, the lessons are far less boring than their video counterparts. Therefore, I can study longer and grasp new skills in no time.
The learning platform and the curriculum are also highly beginner-friendly. It breaks down all the concepts in a way that anyone can understand.
However, Datacamp is not without drawbacks. Most of its assignments and projects are not very challenging once you reach an intermediate level. In my opinion, Datacamp provides too many hints and pre-written codes. Thus, students do not need to write their code from the start.
Furthermore, the curriculum does not drill deep into advanced data science concepts or applications. You will need to buy another course or a training program to be job-ready as a data analyst.
You can create an account to try the first lesson for each course for free.
Get Hired with Datacamp
Datacamp has recently offered a new hiring service. Employers can now list their available positions on Datacamp’s job board. Thus, all paid subscribers can apply for jobs there and potentially get hired.
Pricing
Datacamp has just revamped its pricing structure. Currently, Datacamp offers two pricing plans:
- Premium – starting at $12.42 per month (billed annually)
- Teams – $25 per user per month
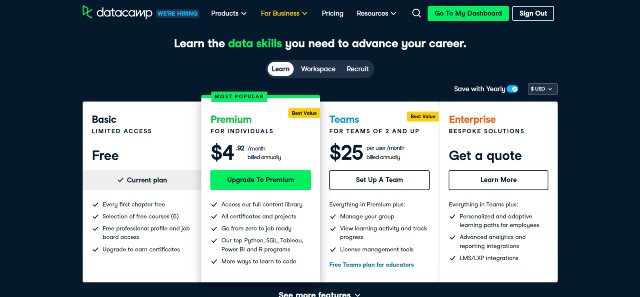
You can access all the learning resources on the Datacamp with the Premium plan. Thus, it is the best option for individual learners.
The Teams plan will offer corporate learning features, such as team performance reports and custom tracks. This plan is thus suitable for companies that want to provide data science training to their employees.
Pros & Cons
Pros
- Comprehensive data science platform, covering all essential topics.
- Beginner-friendly, engaging interactive lessons
- Self-paced learning
- A mobile app is available for students to learn anywhere, anytime.
- Students can get hired through an exclusive job board
- Affordable, all-inclusive pricing: You can take more than 350 courses and many more data science projects.
Cons
- Assignments are no longer challenging when you reach an intermediate level.
- The curriculum does not delve into advanced concepts.
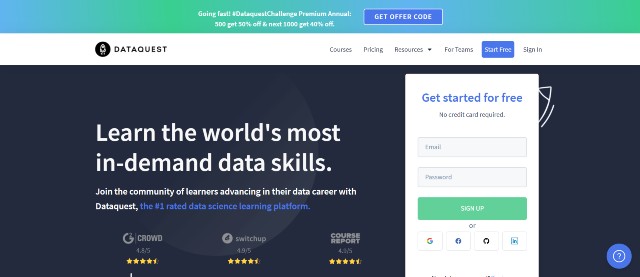
6. Dataquest
Like Datacamp, Dataquest is another excellent platform that uses an interactive approach to teaching data science. If you are looking for engaging data analysis courses, Dataquest is the option that you may want to consider.
Course Content
Dataquest has numerous career paths to select from. However, there are two that I suggest pursuing:
- Data Analyst in Python
- Data Analyst in R
Both paths will walk you through the same data analytics process, such as data cleaning, analysis, and visualization.
However, since they involve different programming languages, your learning experience, and the topics you will learn from each will be distinct.
Based on my observation, the structure of Dataquest lessons is quite similar to those of Datacamp. In other words, you will read the text and code along according to the instructions. Thus, the lessons are also similarly engaging.
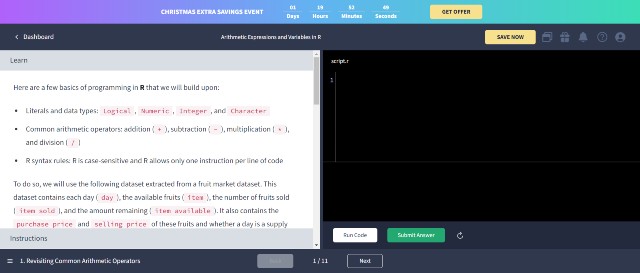
However, Dataquest provides fewer hints and pre-written code than Datacamp. Hence, it encourages learners to think more like a programmer. This is instrumental in developing your skills.
Pricing
Dataquest has two pricing plans as follows:
- Premium – $44 per month (billed monthly), $24.50 per month (billed annually), or $706 (lifetime)
- Teams – Contact Support
All plans provide unlimited access to all courses and features platform-wide, while the Teams plan users can track team performance and access license management.
Individual learners should opt for either monthly or annual plans. The latter would provide better value for money if you spend six months or more on the courses. However, the former is a superior choice if you are a fast learner.
Regarding the lifetime plan, although Dataquest has actively released new content, I don’t think what is available is enough to justify purchasing lifetime access at this point.
Pros & Cons
Pros
- Straightforward curriculum
- Engaging lessons with informative explanations
- In most cases, students will code independently from the start.
- All-inclusive pricing
Cons
- The price tag is high compared to platforms with similar learning experiences, such as Datacamp.
Advanced Courses
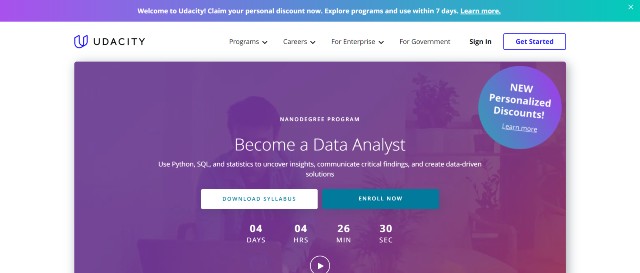
7. Become a Data Analyst Nanodegree Program
This Udacity Nanodegree program is unarguably one of the best options for learning data analytics. Besides its highly informative lessons, this program provides you with abundant opportunities to get hands-on experience and student support that rivals data science bootcamps.
Note: You should be familiar with SQL before enrolling in this program.
Course Content
Created in collaboration with Kaggle and Mode, this program consists of four minor courses as follows:
1. Introduction to Data Analysis – This first course will introduce you to crucial data analysis processes, such as data wrangling and data exploration through NumPy and Pandas. Later, you will investigate and perform the entire process on a real-world dataset.
2. Practical Statistics – The second course will detail how you can apply probability and inferential statistics to real-world case studies. You will then build machine learning algorithms (supervised learning) to study the relationship between variables and make compelling predictions.
3. Data Wrangling – The third course will discuss the data wrangling process, including gathering and cleaning raw data to make them ready for analysis. You will understand how a data scientist handles data quality issues and be able to resolve them on your own.
4. Data Visualization with Python – The final course will delve into data visualization principles. You will grasp the best methods and techniques to create a compelling story using Python and its libraries.
Apart from video lessons, this program includes quizzes, assignments, and real-world projects to help you practice what you have learned and apply that knowledge to practical scenarios. Upon completion, you will be ready to assume the responsibilities of an entry-level data analyst.
Udacity suggests spending 10 hours per week for four months. However, the program is 100% self-paced. You can design an independent study schedule. Keep in mind that the longer you spend on the course, the higher the program fees.
Student Support
With Udacity, your learning experience will be far better than traditional online courses. This is because Udacity will provide students with sufficient student support as follows:
Technical Mentor Support – The most troublesome problem of an online course is a lack of timely and direct support. This is not the case with Udacity because every student can use the chat interface on Student Hub to send questions or request technical assistance from mentors at any time (24/7).
Most students receive a response in less than an hour. Thus, you can always ask for help if you get stuck in a coding problem or encounter technical issues.
Project Reviews – You will complete as many as five challenging projects in this program. Throughout this journey, you can always request expert reviewers to provide feedback and inform you about tips, techniques, and best practices. Thus, you will learn by doing and your data analysis skills will improve over time.
The best thing is that you can send unlimited requests without the need to wait until you have reached a specific milestone on your project. Hence, this will create a healthy feedback loop that will assist your learning.
Career Services – This support is excellent for college students who want to pursue a career in data analytics. The team will review your resume, Github portfolio, and LinkedIn profile to ensure that they properly showcase all your relevant skills.
Thus, you will have a far better chance of securing interviews with tech giants.
Pricing
This program costs $399 per month. Alternatively, you can buy a 4-month bundle that will give you a 15% discount, lowering tuition fees to $339 per month.
Furthermore, if you are a new student, you can create a Udacity account to access a personalized discount, reducing course fees by up to 75% (make sure you combine it with a bundle to minimize your fees).
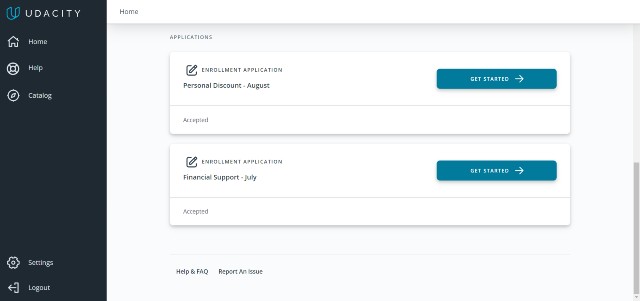
Hence, you can enroll in this top-notch program by paying less than $100 per month using all of these discounts.
[sc name=”udacity” ][/sc]Pros & Cons
Pros
- Taught by Sebastian Thrun, a founder of Google X and Udacity, and a team of professional data analysts and data scientists
- Well-structured and easy-to-follow curriculum
- Beginner-friendly
- In-depth and informative video lessons with high-quality sound and visuals
- Five real-world projects are available for students to complete and obtain crucial hands-on experience
- Timely mentor support
- Unlimited project reviews to enrich your learning experience
- Complimentary career services are a big plus for college students who seek a data analytics career.
Cons
- Costlier than most other alternatives
- Udacity projects can be too challenging for some students.
8. Analytics: Essential Tools and Methods
This edX program is a solid option if you want to learn data analysis in a more formal environment. You will learn from three professors from the Georgia Institute of Technology.
Note: You need to have a solid knowledge of linear algebra and calculus for this program.
Course Content
This program comprises three master-level courses as follows:
1. Introduction to Analytics Modeling – The first course in the series will guide you through analytics models and the best strategies to implement them using R. Furthermore, you will learn how to choose the suitable model for specific scenarios.
2. Computing for Data Analysis – The second course will delve into the math behind modern data analysis, including linear algebra and numerical optimization.
Subsequently, you will learn to use Python, R, and SQL to conduct data analysis on real-world datasets.
3. Data Analytics for Business – The final course will drill deep into business analytics principles and detail the entire process of generating insights from business data. You will learn about relevant challenges and common pitfalls to avoid when performing analytical tasks.
Overall, the curriculum is theory-based but still offers considerable opportunities for students to gain hands-on experience through various case studies and projects.
Regarding the pace, Georgia Tech recommends spending 8-10 hours per week on the coursework, and you will complete the entire program in 10 months.
However, this program is instructor-led. All assignments have a fixed due date. Therefore, you will not be able to study at your own pace.
You can audit this program for free or subscribe to a verified track ($2475 one-time) to access graded assignments, a digital certificate, and nine master’s degree credits from Georgia Tech. The latter only applies to students who apply to Georgia Tech’s OMS Analytics program and get accepted.
Pros & Cons
Pros
- Learn from a team of three professors from a renowned US university
- Well-structured curriculum
- Detailed explanations of theories and mathematical notations behind data analytics
- Unlike most instructor-led courses on edX, this program is available year-round (at least until the end of 2023)
- You can receive as many as nine master’s degree credits if you complete this program AND manage to enroll in Georgia Tech’s OMS Analytics program.
- All courses are free to audit.
Cons
- Costlier than other alternatives
- Instructor-led (fixed due dates for all assignments)
Executive Courses
Below are data analytics courses for executives. The curriculum of these courses will focus far less on coding. These courses will approach data analysis from a managerial perspective. In other words, you will learn how to analyze and interpret data to bring the most impact on your organization.
All executive courses have no prerequisites.
9. Data Analysis for Management
This program from the London School of Economics and Political Science (LSE) on the Getsmarter platform is unarguably one of the best options for executives and entrepreneurs to develop data analysis skills.
Course Content
This program comprises eight weekly modules. Therefore, you will complete the program and receive a digital certificate in eight weeks.
Below is a summary of what you will learn from each module.
1. Decision-Making Under Uncertainty – The first module will outline various challenges in the decision-making process under uncertainty. You will explore business case examples to grasp how data-driven models can assist in decision-making and solve relevant problems.
2. Data Visualization and Descriptive Statistics – The second module will guide you through data reduction principles. Subsequently, you will learn to use Tableau to summarize and visualize your data.
3. Quantifying Risk Through Probability – This module will show how probability distributions can be instrumental in making informed decisions. You will then qualify risks for different scenarios.
4. Data Integrity and Statistical Inference – The fourth module will shed light on data quality. You will understand how unreliable data can impact business decisions and grasp the steps to identify them. For example, you will learn to calculate estimation errors
5. Evidence-based Decisions – This module will teach you how to conduct statistical analysis. In other words, you will learn the concepts of statistical significance and conduct hypothesis testing to test business claims.
6. Understanding the Causes of Things – This module will delve into regression analysis, including its fundamentals, challenges, execution strategies, and steps to evaluate the results.
7. Time-Series Forecasting – The seventh module is all about time-series analysis. You will learn how to analyze data that have components such as trends, seasonality, and cycles. All of these are common in business data from every industry, especially retail.
Subsequently, you will learn about the techniques to predict future time series so that you can make informed decisions based on them.
8. Delivering Insights Through Storytelling – The last module is a large-scale project where you will apply all the knowledge from previous courses to a real-world scenario.
You will generate insights from a dataset, visualize them, and develop a summary report to communicate identified opportunities to your audience.
LSE recommends spending 7-10 hours on each weekly module, which is manageable for managers and executives.
Besides the video lectures, all students will gain access to the following resources and activities that will enrich their learning experience:
- Downloadable resources
- Quizzes, assignments, and exams
- Real-world projects
- Interactive content such as live polls and infographics
- Weekly class forums & Small Group Discussions
Class forums and small group discussions differentiate this program from other data analytics courses. You will have opportunities to connect with your classmates worldwide and potentially form a long-lasting relationship like enrolling in an executive program at a business school.
Regarding pricing, this program costs $2041 one-time. You can pay tuition fees before the program starts or through a split payment plan.
If you need more information, I suggest downloading a course prospectus or requesting a call by clicking the link below.
Pros & Cons
Pros
- Taught by Dr. James Abdey, a renowned faculty member of LSE, one of the best UK universities
- Receive an official certificate of completion from LSE
- Feature numerous real-world case examples
- Provide various assignments to complete to assess your skills and gain hands-on experience
- Offer networking opportunities through class forums and discussion groups
- Flexible payment options
Cons
- Not always available: The program is only available on specific dates.
- Expensive than other alternatives
10. Data Analysis for Decision-Making
This edX program from RIT is a robust alternative to learn data analysis to strengthen your decision-making skills.
You will learn to use different software products (Excel and Tableau) to identify key points from the data and integrate them with other crucial information to make better business decisions.
Course Content
This program has three minor courses as follows:
1. Data Literacy Foundations – The first course will detail all the essential steps for leaders to make data-driven decisions. You will learn about legal and ethical issues surrounding data usage and how to develop critical thinking skills when working with data.
Subsequently, you will explore data analysis tools and techniques for specific scenarios.
2. Data Processing and Literacy with Excel – The second course will guide you on using Microsoft Excel to perform data analytics tasks, such as developing appropriate data analytics plans, clearing data, and creating various charts to visualize data.
3. Data Representation and Visualization in Tableau – The final course will walk you through Tableau basics. You will then learn to analyze data from various sources, generate insights, and communicate them through data visualizations.
RIT suggests spending 6-8 hours per week on the program, and you will complete it in 3 months.
As an edX program, auditing is free. You can also opt for a verified track at $672 to access graded assignments and a digital certificate.
Pros & Cons
Pros
- Beginner-friendly
- Well-structured curriculum
- Include two informative courses on two of the most popular data analytics tools
- Self-paced learning
- Easy-to-read transcripts
- Free auditing
Cons
- Do not delve into advanced concepts like other courses
11. Project Pro (Exclusive)
Project Pro is like no other on this list. The platform does not offer data analytics training courses or programs. Instead, it provides learners with more than 120 end-to-end data science and machine learning projects to complete.
Therefore, if you have completed some courses but still have no confidence in applying the concepts in real life, Project Pro is where you can obtain significant hands-on experience and become ready for any data science job.
Project Resources
Below are the resources that are available for each project.
- Detailed project descriptions and objectives to help you get started
- Real-world datasets to work on
- Video solutions (2-5 hours long)
- Coding solutions and datasets
Hence, all projects you work with are end-to-end. You will complete the entire project from data sourcing, data analysis, and all the way to data visualization or deployment.
Thus, these projects will be worthy of a Github inclusion to showcase your skills to future employers or clients.
Pricing
Project Pro offers two pricing plans as follows:
- 6-Month Access – $135 per month on average ($810 for six months)
- Annual Access – $73 per month on average ($876 for 12 months)
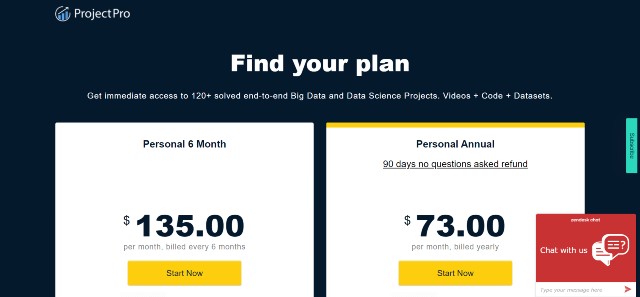
Both plans provide access to all existing projects and their resources on the platform. However, by paying only an extra $66, the annual plan will give you another 6-month access and the following:
- 3-5 new projects every month
- 1-to-1 mock interview and resume prep
- Email Technical Support
Thus, it is a no-brainer to subscribe to the annual plan. With these vast numbers of projects, you will have sufficient content to work on for more than a year. If you are unsatisfied, you can use the 90-day money-back guarantee to request a full refund.
Other Alternatives
Data Analysis for Life Sciences – Created by Harvard, this professional certificate program on edX is an excellent choice to learn data analysis for healthcare professionals. You will learn how to use R to analyze data and perform statistical inference.
Data Analytics: Hands-on – This program by PluralSight covers all essential data analytics concepts. However, it has not been updated since 2015. Thus, I don’t think it is the best choice that you may want to consider.
Related Courses
Below are links to a list of the best courses on various topics that I believe will help strengthen your skills as a future data analyst.
Power BI – another extremely popular data analytics tool used by companies worldwide
Marketing Analytics – The best option if you want to pursue a career in marketing. You will learn to manage and analyze data from many sources, such as your ad campaigns or Google Analytics.
Predictive Analytics – Predictive analytics is a branch of advanced data analytics. If you want to be a master in business forecasting, taking one of these courses is a must.
Business Analytics – Unarguably the best choice if you want to pursue a business analyst career. You will learn even more about conducting data analytics in real-world business cases.
Big Data Analytics – Coming Soon